Introduction
- earlier, we had “monoliths”, so they had to be developed using “waterfall model”
- now “microservices” are developed using “ci cd”, so each module can be deployed and maintained individually
- “monitoring” - collect data about systems regularly
- success is measured using mttd and mttr
- “mttd” - mean time to detect - time between when issue actually happens and when teams become aware of it
- “mttr” - mean time to resolution - time between between detection and when system is operating normally
- now, we discuss some methods for monitoring - “red”, “use”, “four golden signals” and “core web vitals”
- “red” method - useful for monitoring “requests” -
- “rate” - requests per second. also called “throughput”, “traffic”
- “error” - failed requests
- “duration” - transaction response time. also called “latency”
- “use method” - used for monitoring “resources” i.e. infra -
- “utilization” - amount of resources being used - e.g. cpu % etc
- “saturation” - requests being queued or dropped - should be closer to 0
- “error” - failed operations, e.g. disk writes
- “four golden signals” - by google - if you can focus on only 4 metrics, focus on these four - red + s from above
- “core web vitals” - for monitoring performance for end users experience in browsers -
- “lcp” - largest contentful paint - how quickly the main content of the page loads
- “fid” - first input delay - how long it takes for the browser to respond to the user’s first interaction
- “cls” - cumulative layout shift - how often the users experience unexpected layout shifts
- note - websites with lower values of “core web vitals” are ranked lower in search results
- monitoring works when we know what to monitor / we know the metrics beforehand. however, with distributed systems, this might not always be the case
- hence, we have “observability” - it helps us dig deep into the issues, when we do not know about it beforehand
- monitoring can help us with “when” something is wrong. observability helps us with “why” something is wrong
- for observability, we collect “melt” data -
- “events” - discrete occurrences in our application. e.g. selling of a product, delivering of a product, etc
- “metrics” - events are expensive to store and more importantly, query. so, we use metrics, which are pre aggregated views. note - due to these aggregation, we loose out on granularity when using metrics
- “log” - logs can have a lot more details. an event can have multiple logs
- “traces” - traces track a series of “causal events” across distributed microservices
Platform
- new relic is an “observability platform”
- it helps organize, analyze, alert, etc on the data we send that we discussed above
- this is done by adding an “agent” to the services. this process is called “instrumentation”
- below, we discuss the different types of agents new relic supports
- “apm agents” - 8 languages like java, php, etc supported by new relic. along with that, we can use otel too
- it already does “automatic instrumentation” for most things like tracing and instrumenting popular libraries, but we can add “manual instrumentation” as well
- “browser agents” - for core web vitals and other kpis. it also supports “spas” (single page applications) and sending business data. similarly, we have “mobile agents” as well
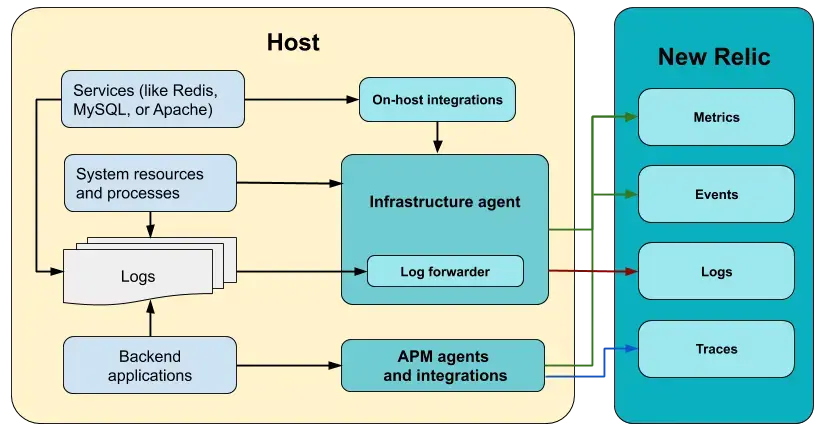
- “infrastructure agents” - we add these agents to our hosts, and then it gets access to things like system resources, processes etc
- infrastructure agents also have a separate log forwarding component embedded inside, just for logs
- finally, infrastructure agents also act as the intermediary between new relic and “on host integrations”
- “on host integrations” or “ohi” - for third party services like postgres, redis, etc, since we do not have access to their code directly
- if they have an endpoint that can be queried / files that the ohi can read, the data can be sent to new relic
- below is the entire architecture of agents sending data to new relic. notice how the working of logs is a little different. this is important, because in most architectures, shipping of logs is carried out separately just like this
- new relic helps with “end to end” observability. there are some more features present inside new relic
- “synthetics” - developers can run complex user journeys in the form of automated tests to ensure that the application is working as intended. this way, we run into issues automatically before an end user. the idea would be to create “alert conditions” at the back of these synthetic monitors, and be alerted in case of failures
- “new relic code stream” is a plugin for the ides like jetbrains and vs code, with which we are able to easily jump between the logs and code from within the ide. it also allows us to visualize the performance of parts of our code, anomaly detection features to detect issues since latest releases, etc
- all the telemetry data is ingested into the “new relic database”
- “entities” -
- anything that reports data to new relic. e.g. the agents report data to new relic
- anything that has data that new relic has access to. e.g. new relic can pull data from cloud services
- entities are identified using a unique id called “entity guid”
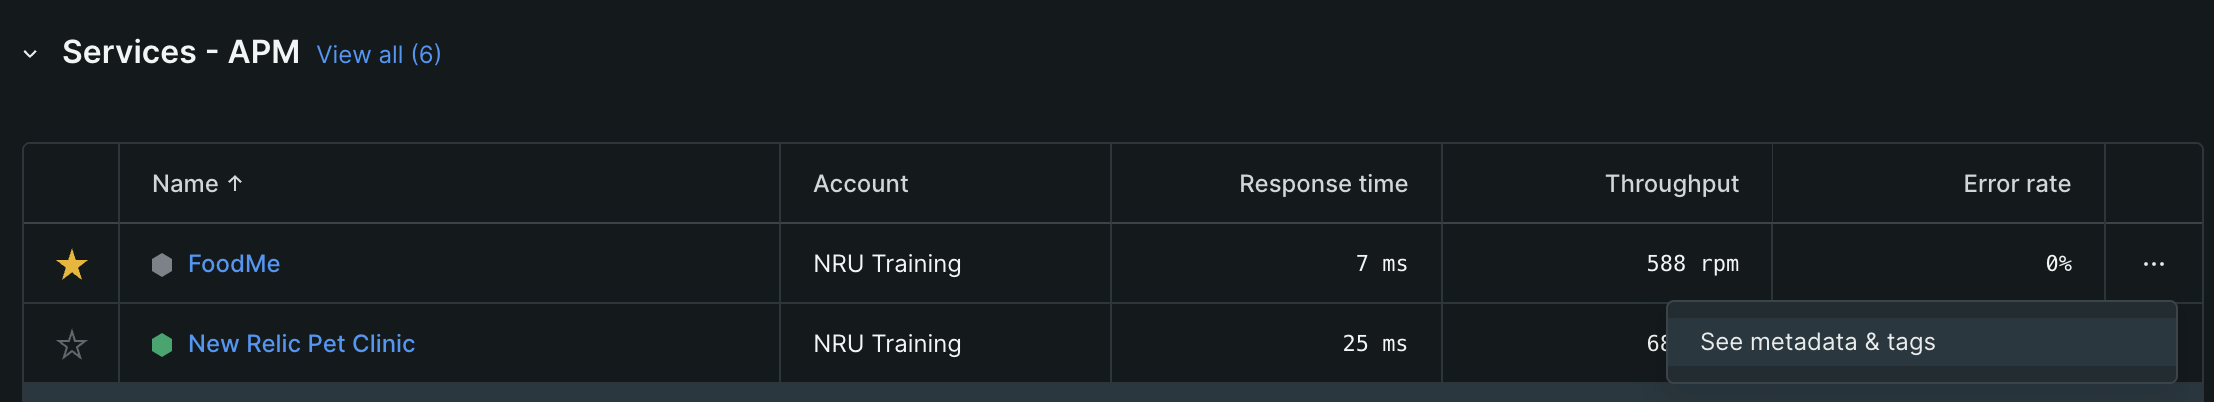
- go to the “all entities” tab from the left sidebar. there, select “see metadata and tags” for an entity. here, we can see the metadata like the “entity guid” we discussed above, and the tags for that entity
![]()
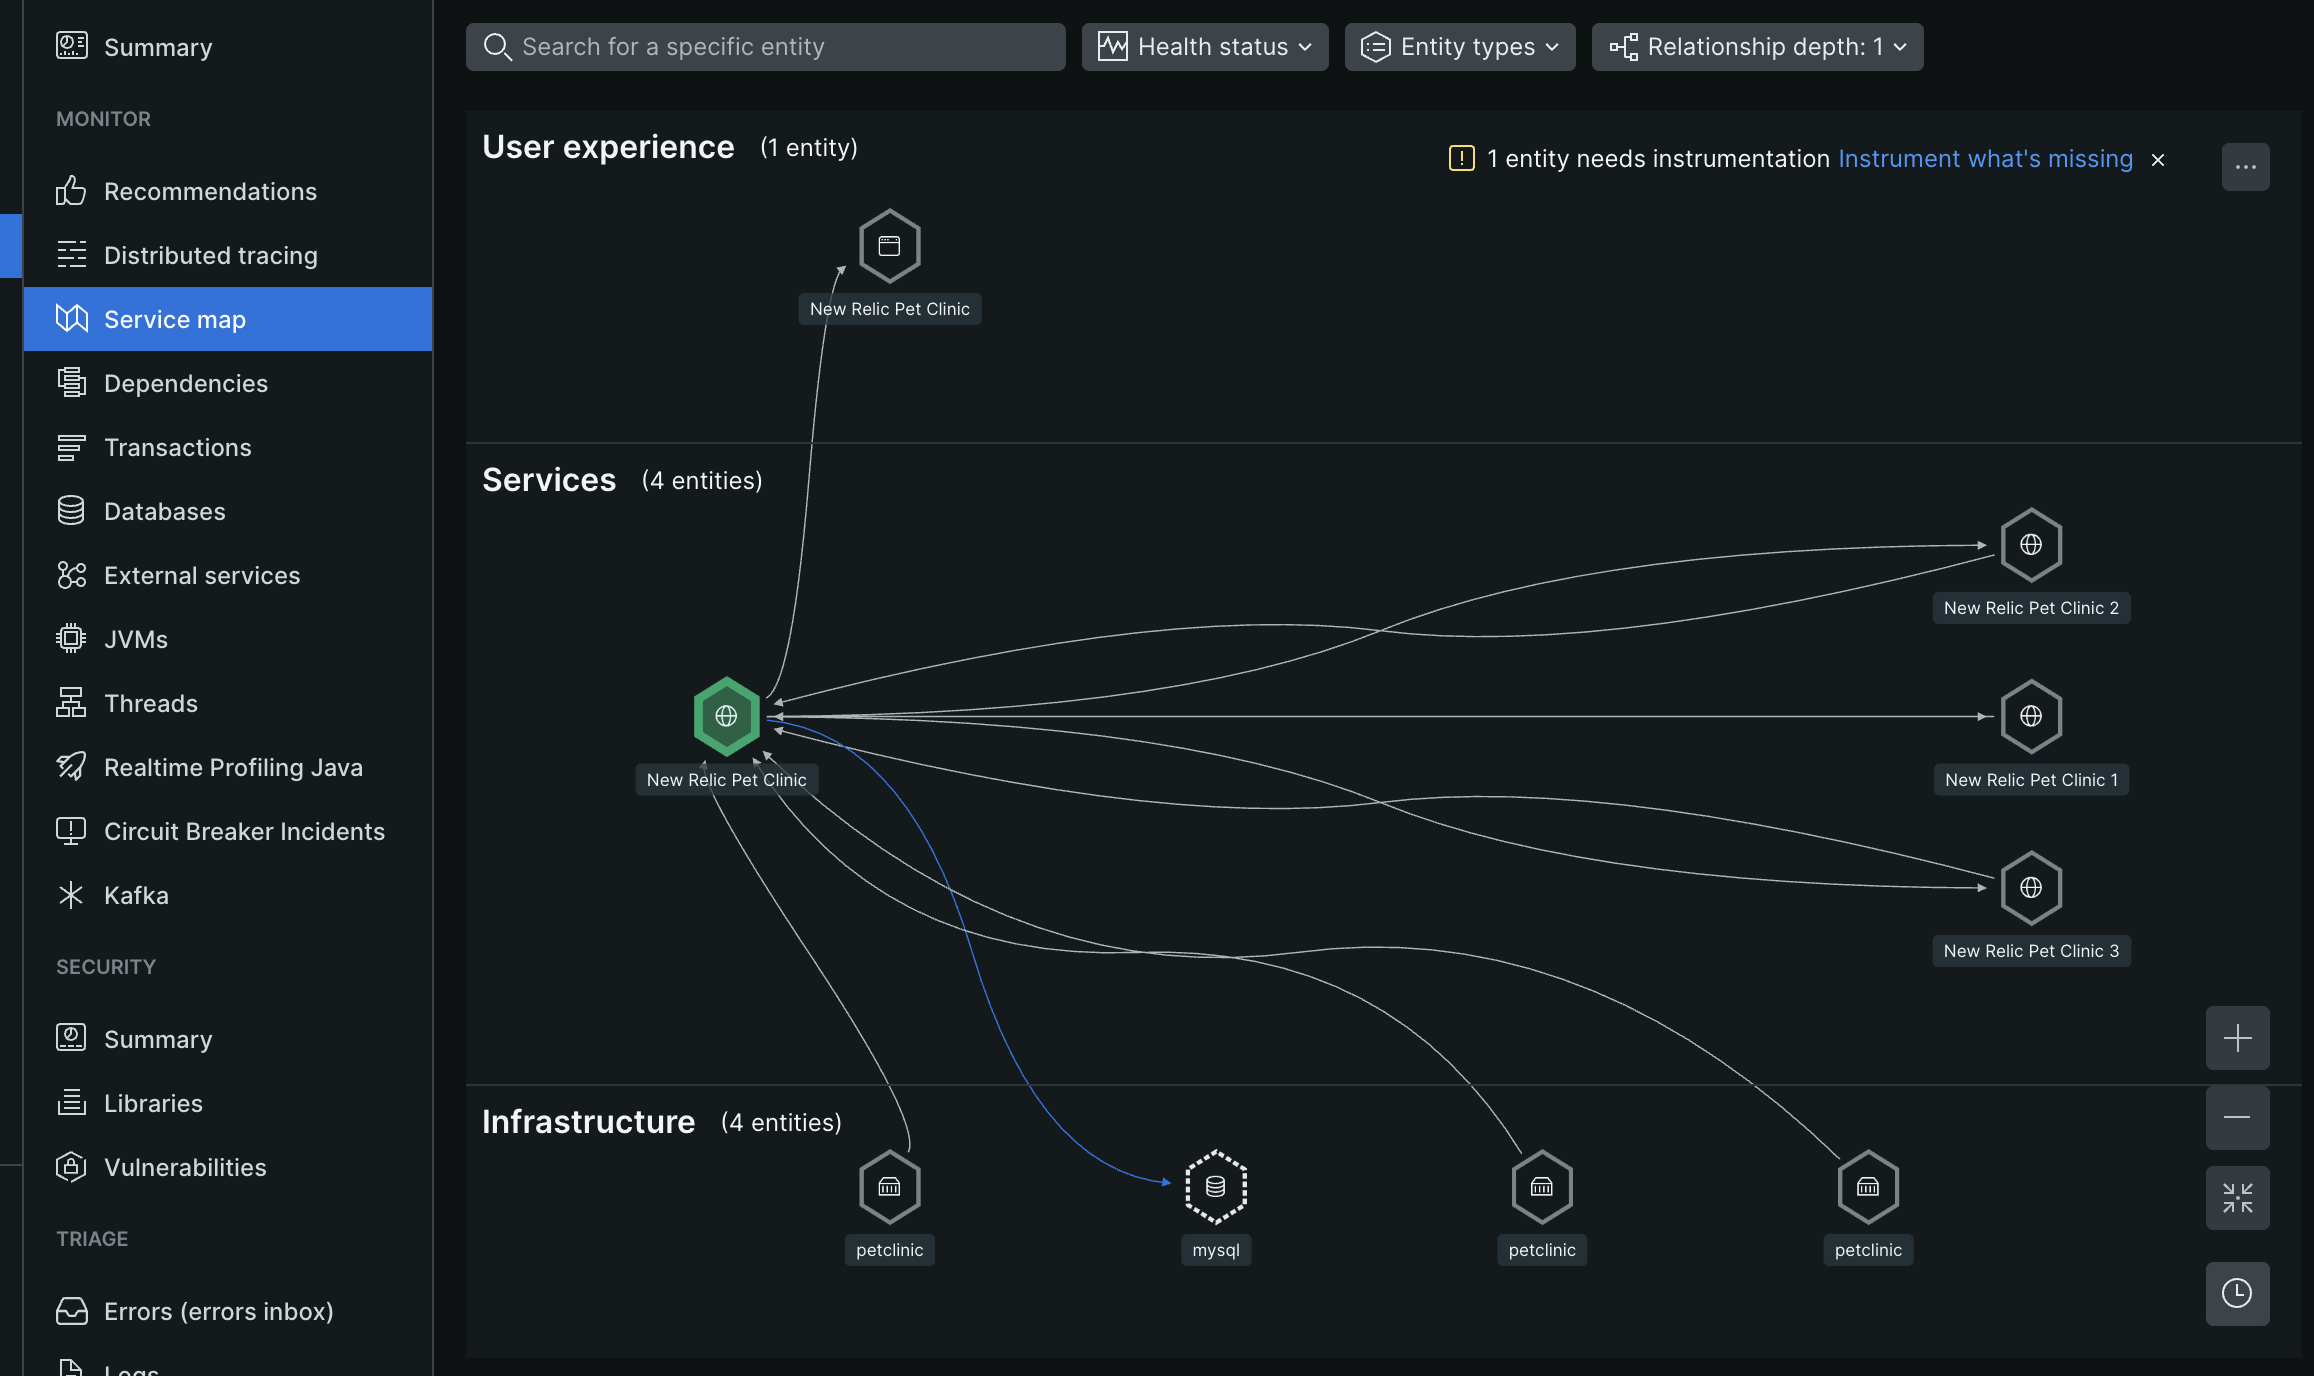
- navigate to the “service map” tab for an entity. this shows us the relation between the entities, and distributes it in the right layer - ui, services and infrastructure
![]()
- we can use “distributed traces” to view the path and various interactions between the different services
- there are “three views” which we can go to from both “all entities” or “apm and services” tab - list, navigator and lookout views
- my understanding - the apm and services tab is basically the “all entities” tab with the added filter of entity type being “Service - APM” or “Service - OpenTelemetry”
- “list view” - see all the entities in a tabular form and filter them
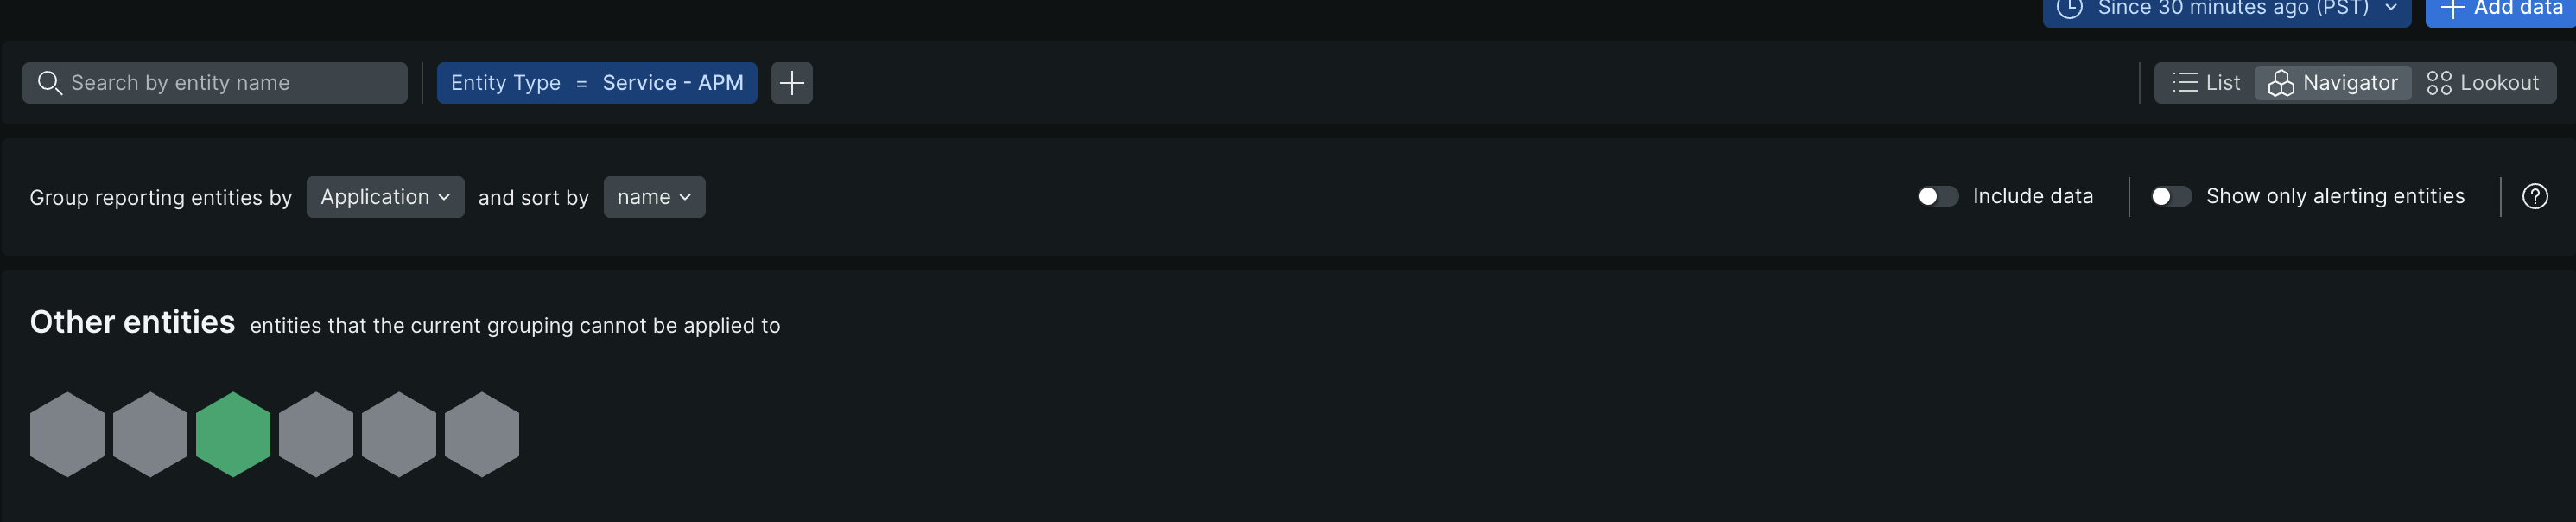
- “navigator view” - see the entities which are healthy vs have active alerts at a glance
- example of navigator view - the one in green has no alerts in progress, others do not have alerting setup
![]()
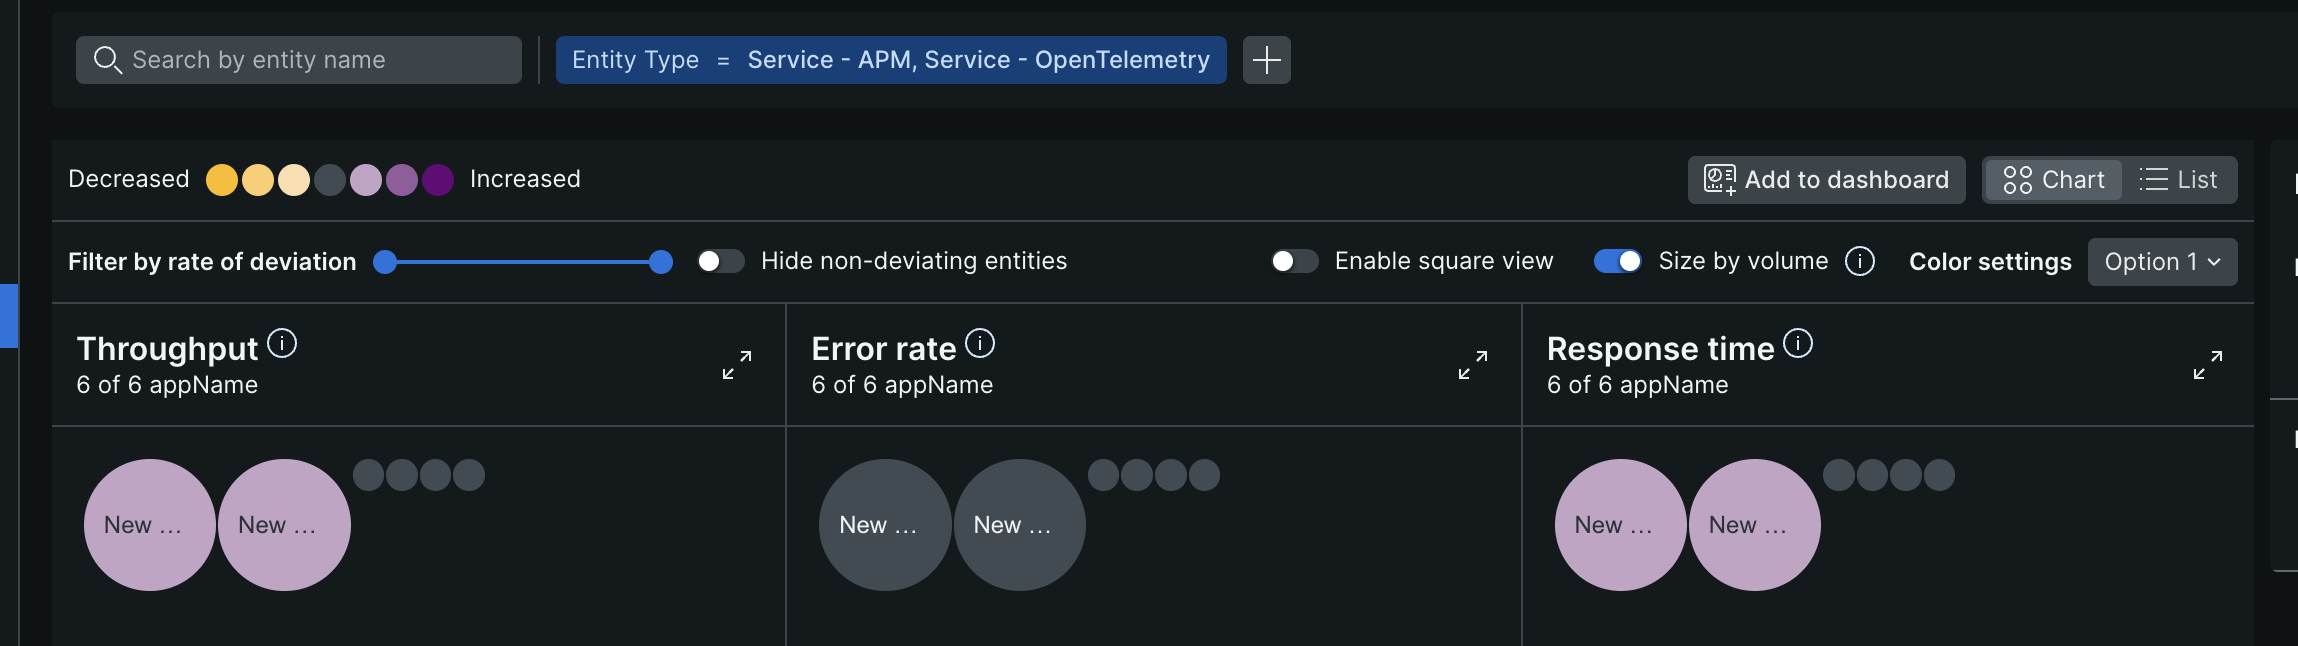
- “lookout view” - spot the unusual performance changes across entities at a glance. e.g. ones in purple have recent spikes, while ones in yellow have decreased usage. we can also enable the option of “size by volume” to look at the services with spikes by size
![]()
- we can define relationships between entities using “tags”. then, when we enter a tag, say team=cloud, we will only see cloud related entities below
- a logical grouping of entities is called a “workload”, and workloads have a “workload guid”. we can add different entities and even dashboards to a workload, and then this workload itself becomes like an entity that we can query using the workload guid
- when adding entities to a workload, instead of adding every entity manually, we can instantiate a workload using a “query”, e.g. we can tell that cloud workload will have all entities tagged using team=cloud. this means that whenever a new entity is tagged with team=cloud, it becomes a part of this workload automatically
Performance Monitoring
- “browser agents” - only a few lines of javascript code needs to be injected into our webapp to enable this
- the idea is to first to look at the “summary” tab of the browser tab, and eventually start drilling into specific tabs like “page views”, “ajax”, etc
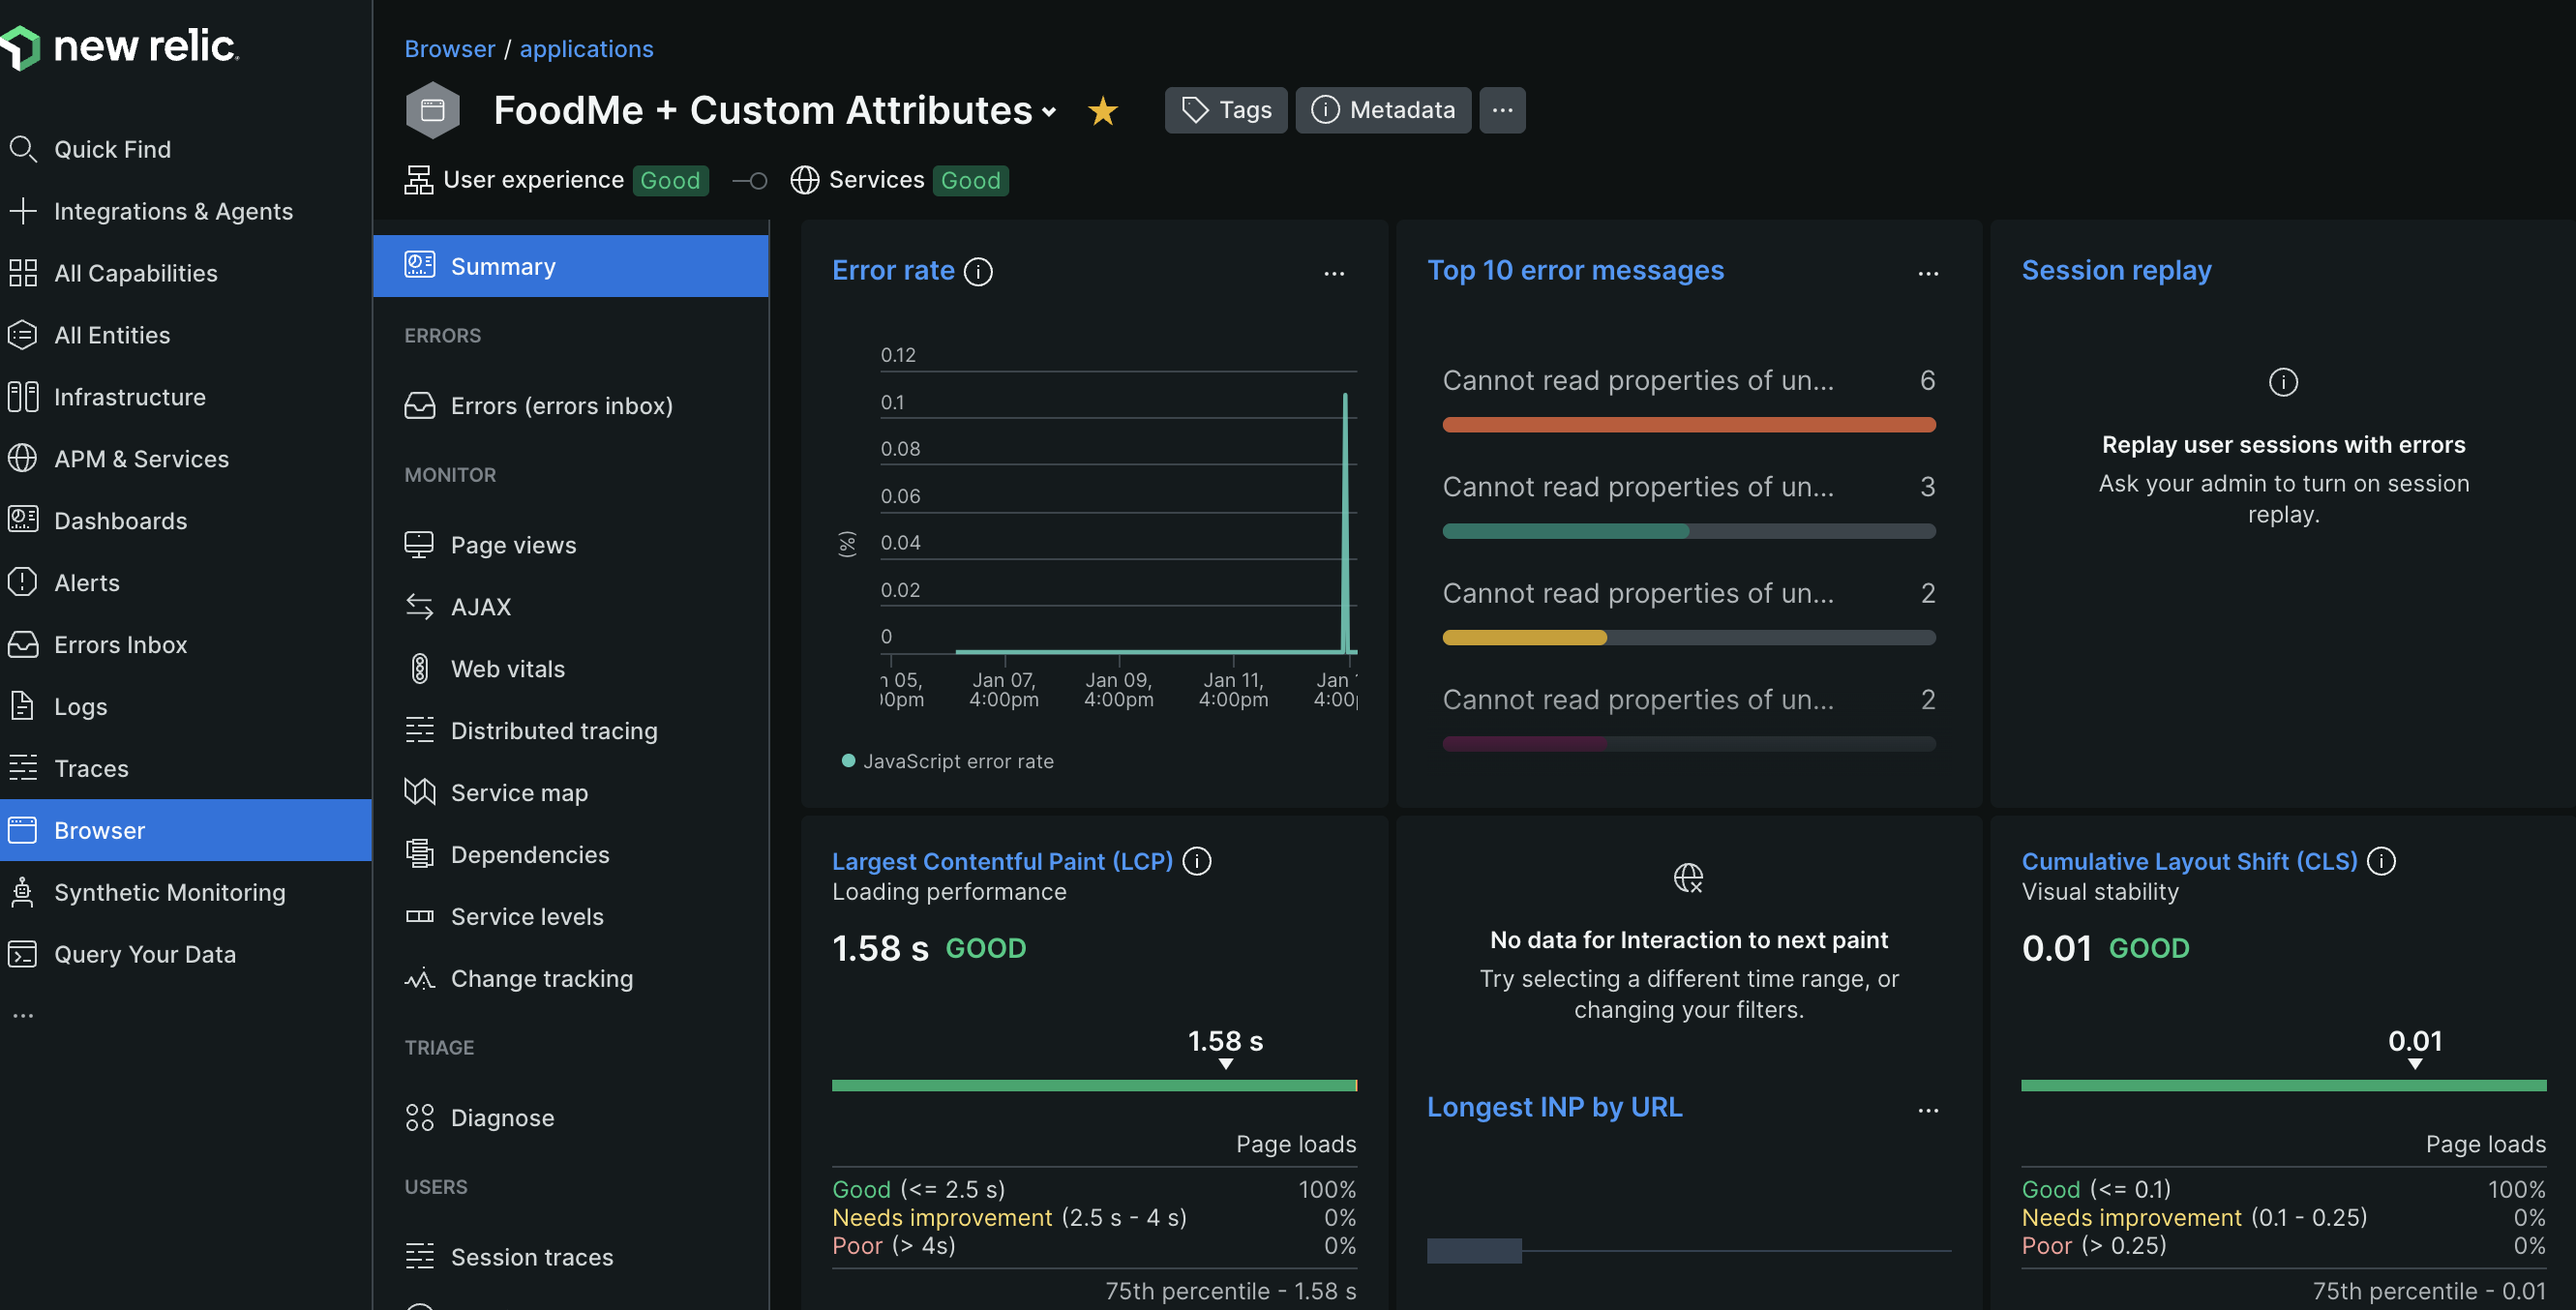
- there are charts for the time taken, broken down into the time taken for the server to respond, the dom processing, the time taken for the app to render, etc
- the ajax response calls can show us the kind of api calls that are made, and how much time is spent on them
- a lot of these prebuilt charts also allow switching between mean, median, mode
- the “page view” tab can tell us the pages that were visited and for each of them, the different api calls that those pages made and the times they took
- tip - here, sort by “most time consuming” to understand which optimizing which pages is worth our time
- “session traces” - like a distributed traces but specific to browsers. it shows us times taken by dns lookups, times taken for each of the assets to load, time taken by the ajax calls, etc
- we can also see details like the systems the browser is being accessed from, the geography of the user, etc
- we can view errors grouped by error message and inspect the details
- we can also see the “session replay” of these errors that occur to inspect into the errors further
- again, there is a “summary” tab just like in case of browser, which can give us basic details about currently ongoing “issues”, changes since “last deployment”, “critical vulnerabilities” in our app, etc
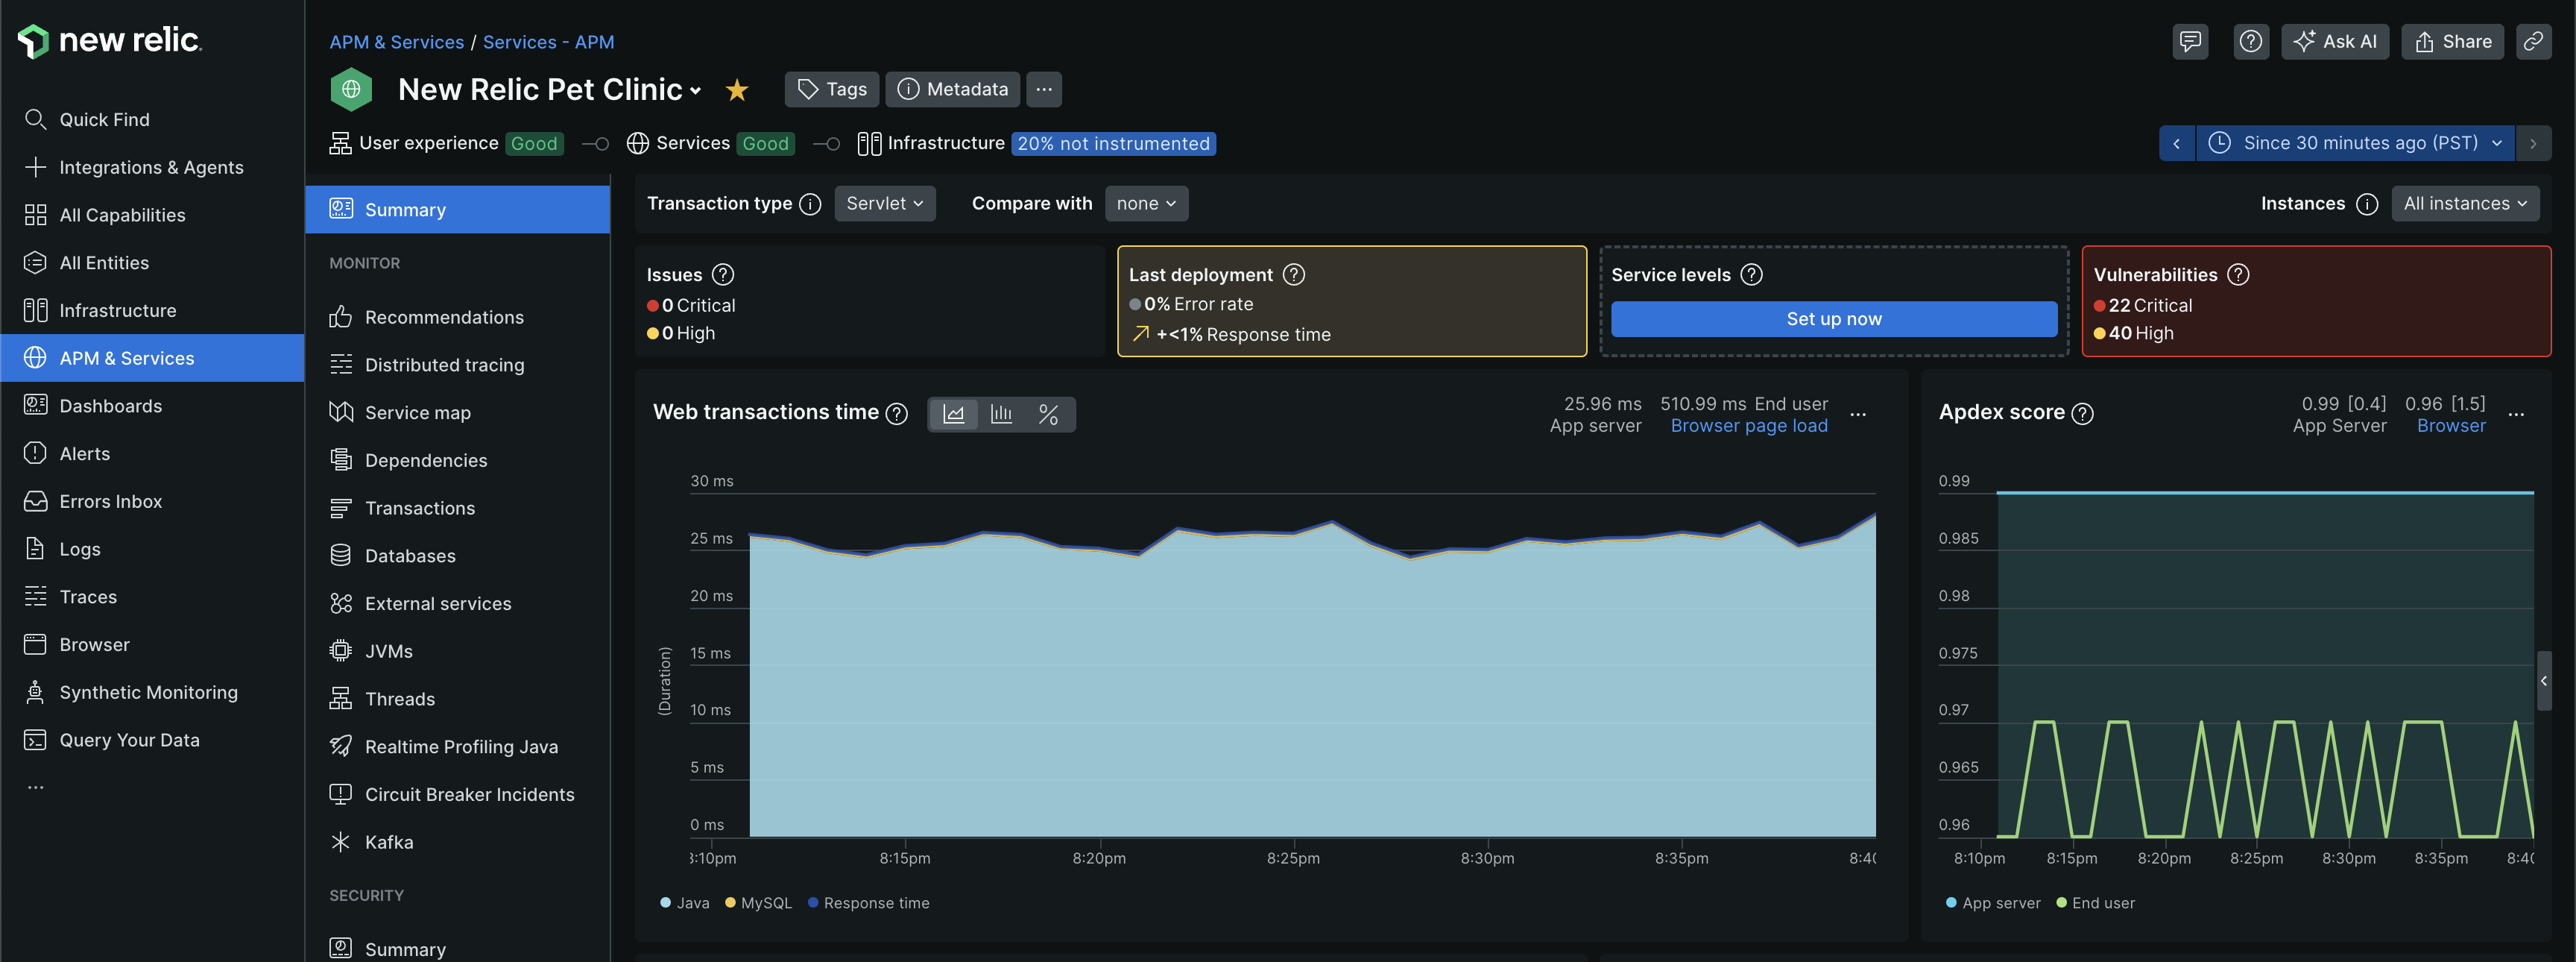
- about issues - one or more “incidents” create an “issue”
- incidents are created when we set up “thresholds” using “alerts conditions”
- my understanding - we can label them as “high” or “critical”
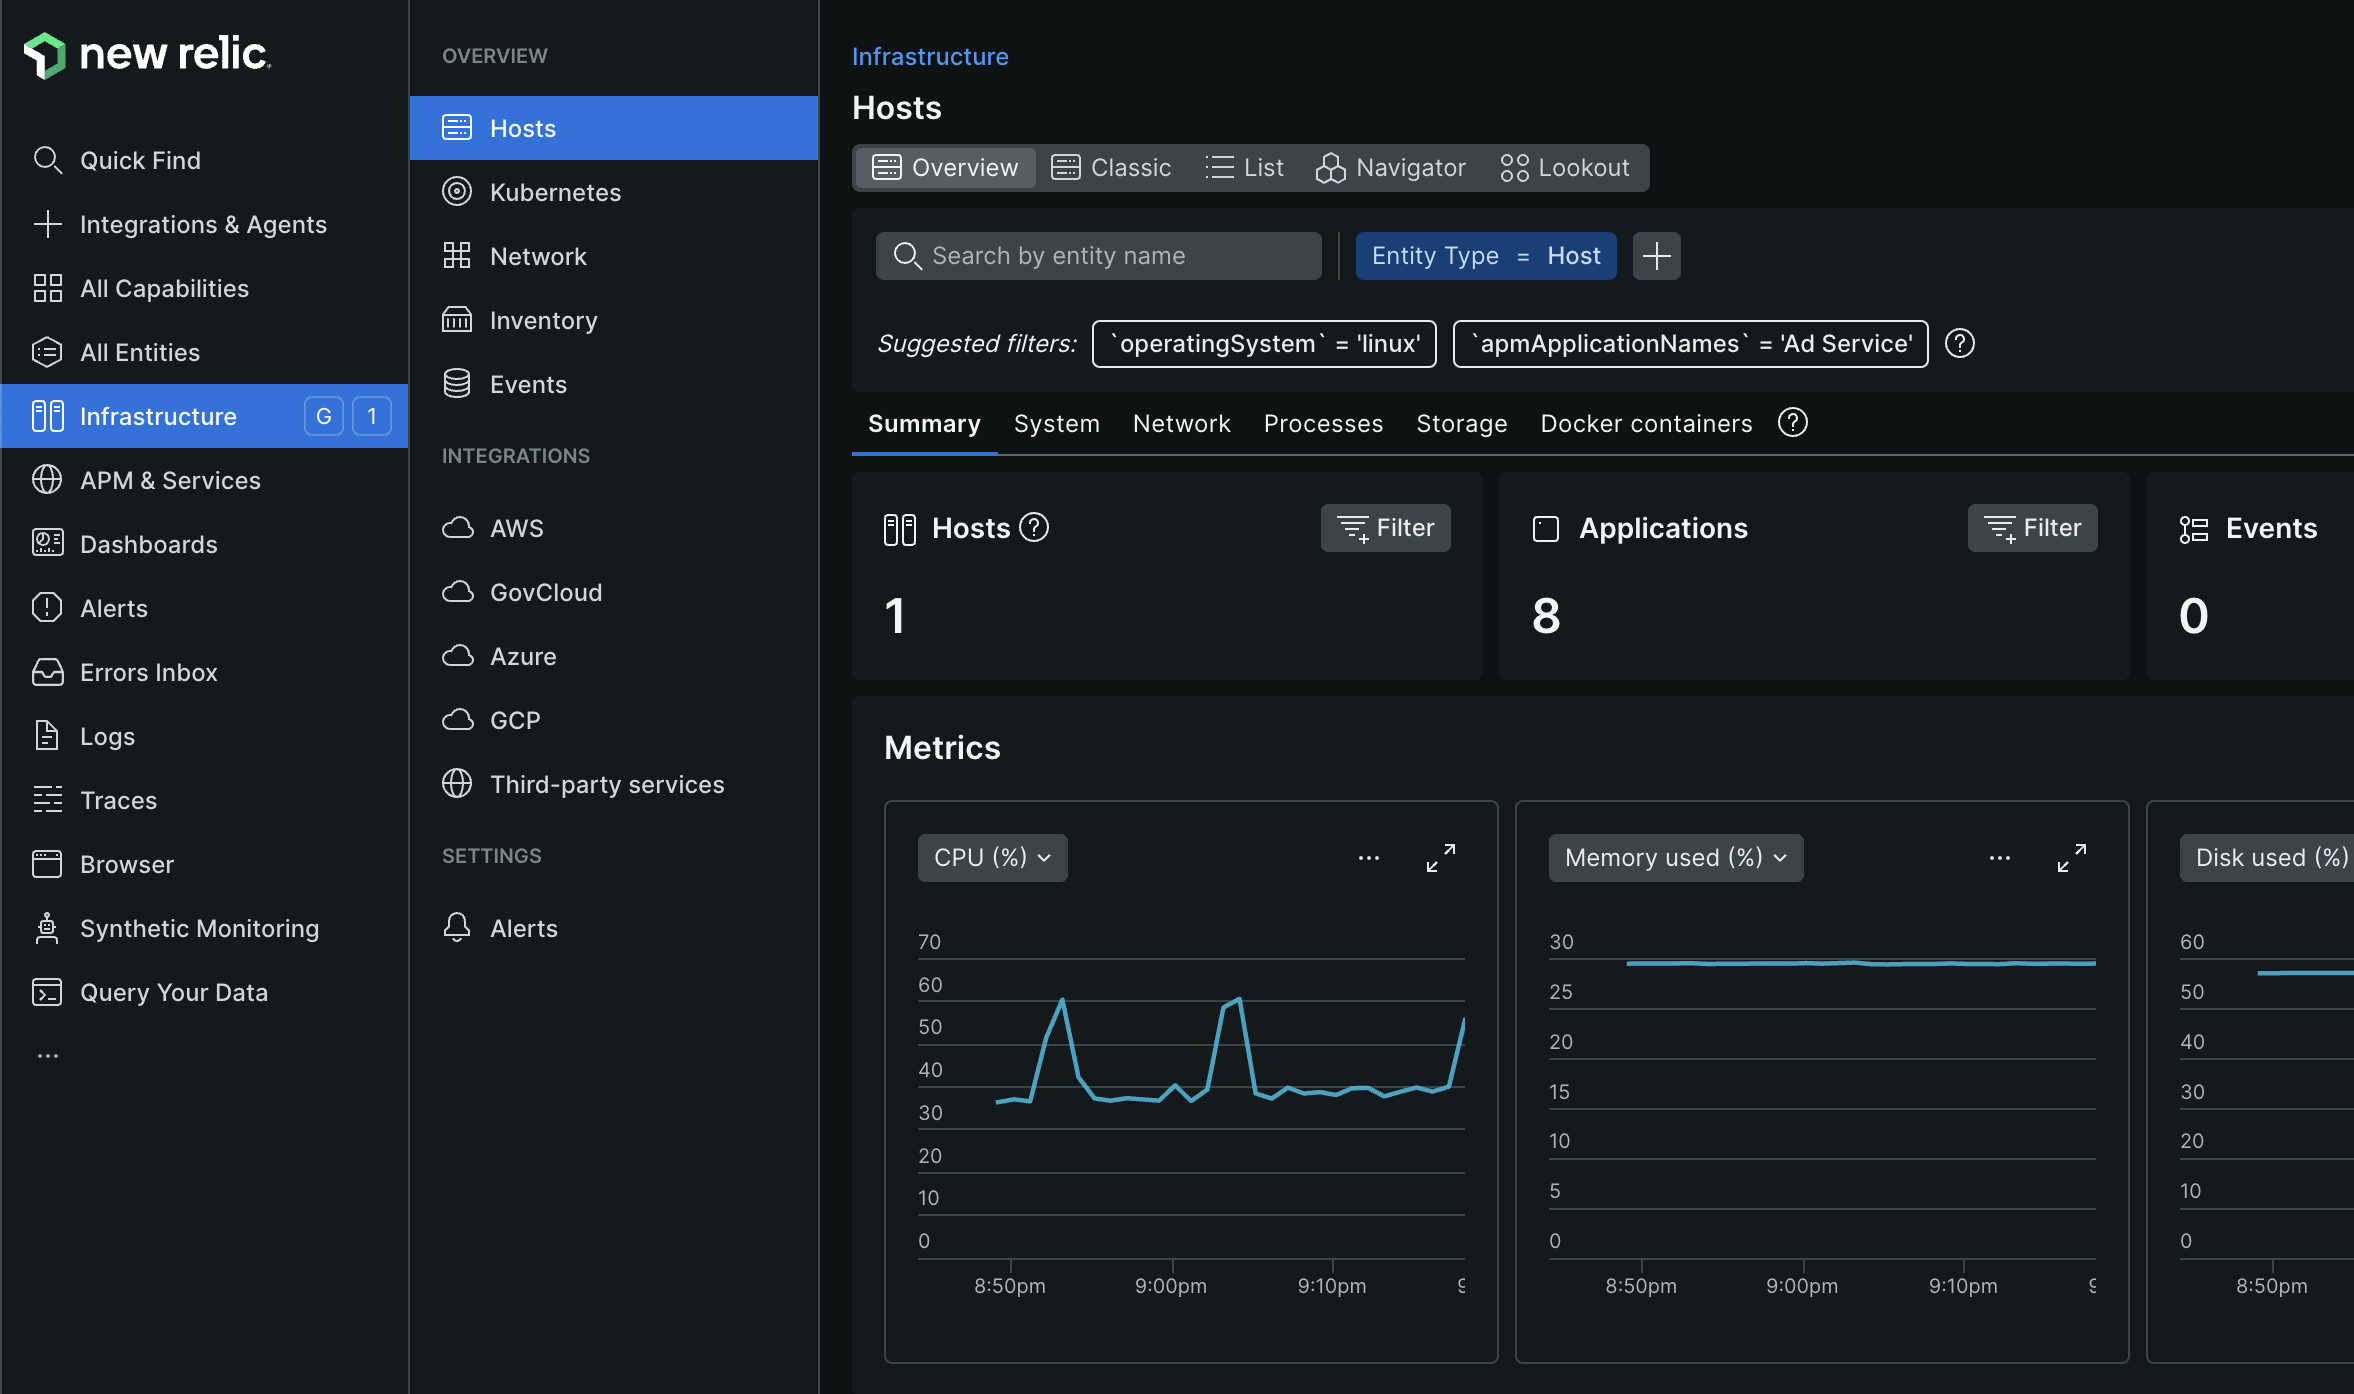
- recall host metrics can contain data from both “new relic infrastructure agent” and “on host integration”
- we can jump to the metrics of a host from a particular service in the “apm & services” tab, or go to it from the “infrastructure” tab directly
Configuring Observability
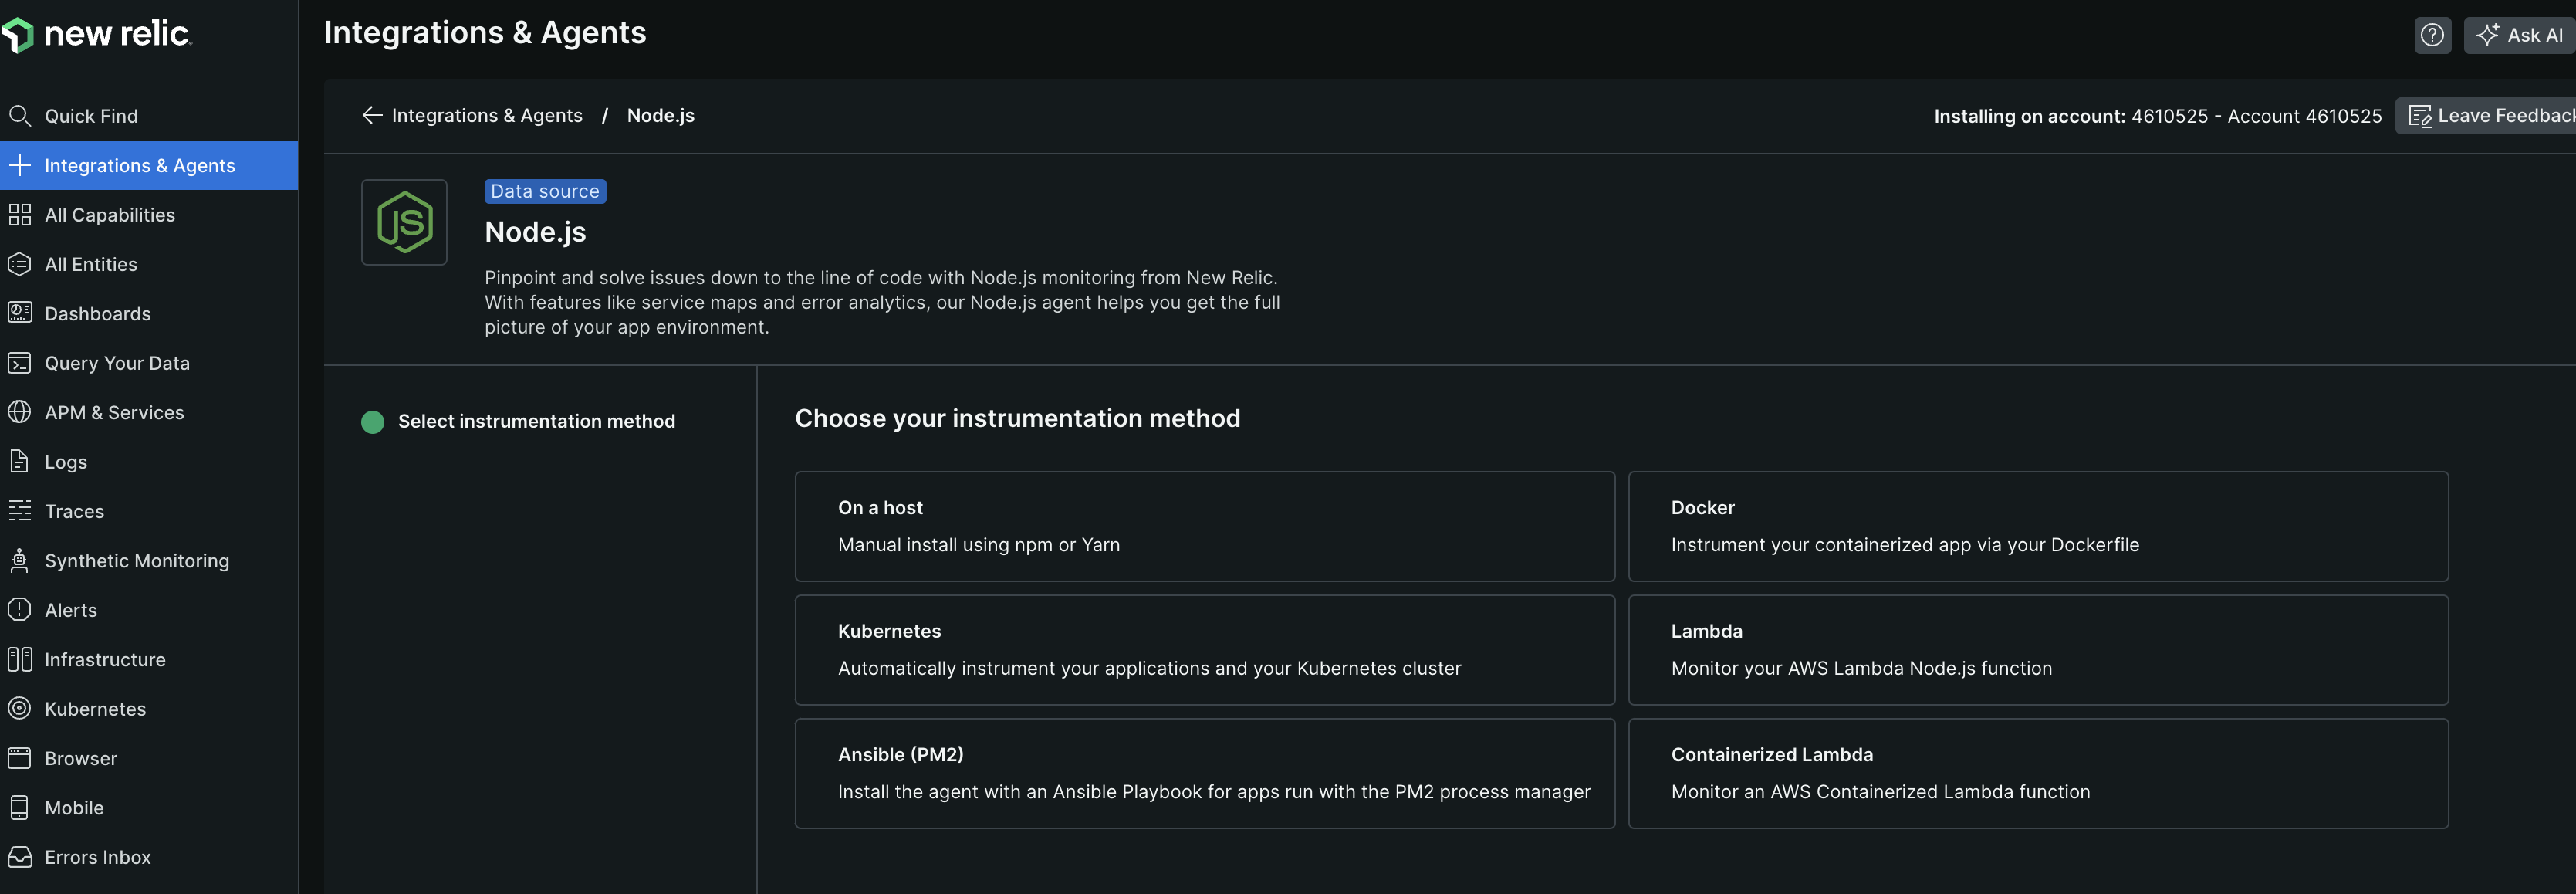
- we can go to new relic -> integrations & agents tab from the left sidebar. it will show us how to perform the instrumentation for our particular use case. e.g. if i type nodejs and click on it, it shows me the various options like below, and i can chose any one of them to start instrumenting my nodejs applications
![]()
- i chose “on a host”, which would mean i would run
npm install newrelicmanually. then, the two options that need to be set areNEW_RELIC_APP_NAMEandNEW_RELIC_LICENSE_KEY - finally, we can run the server code using
node -r newrelic file_name.js - adding custom instrumentation will look like so -
var newrelic = require('newrelic'); newrelic.addCustomAttributes({ 'customer': order.deliverTo.name, 'restaurant': order.restaurant.name, 'itemCount': itemCount, 'orderTotal': orderTotal }); - then, we can check if this is working using the following nrql -
SELECT count(*) FROM Transaction FACET restaurant - similarly, we can also add custom instrumentation to the browser code as follows -
self.items.forEach( function(item) { newrelic.addPageAction('orderItem', { restaurant: self.restaurant.name, item: item.name, qty: item.qty }); } ); - and then, query this as follows -
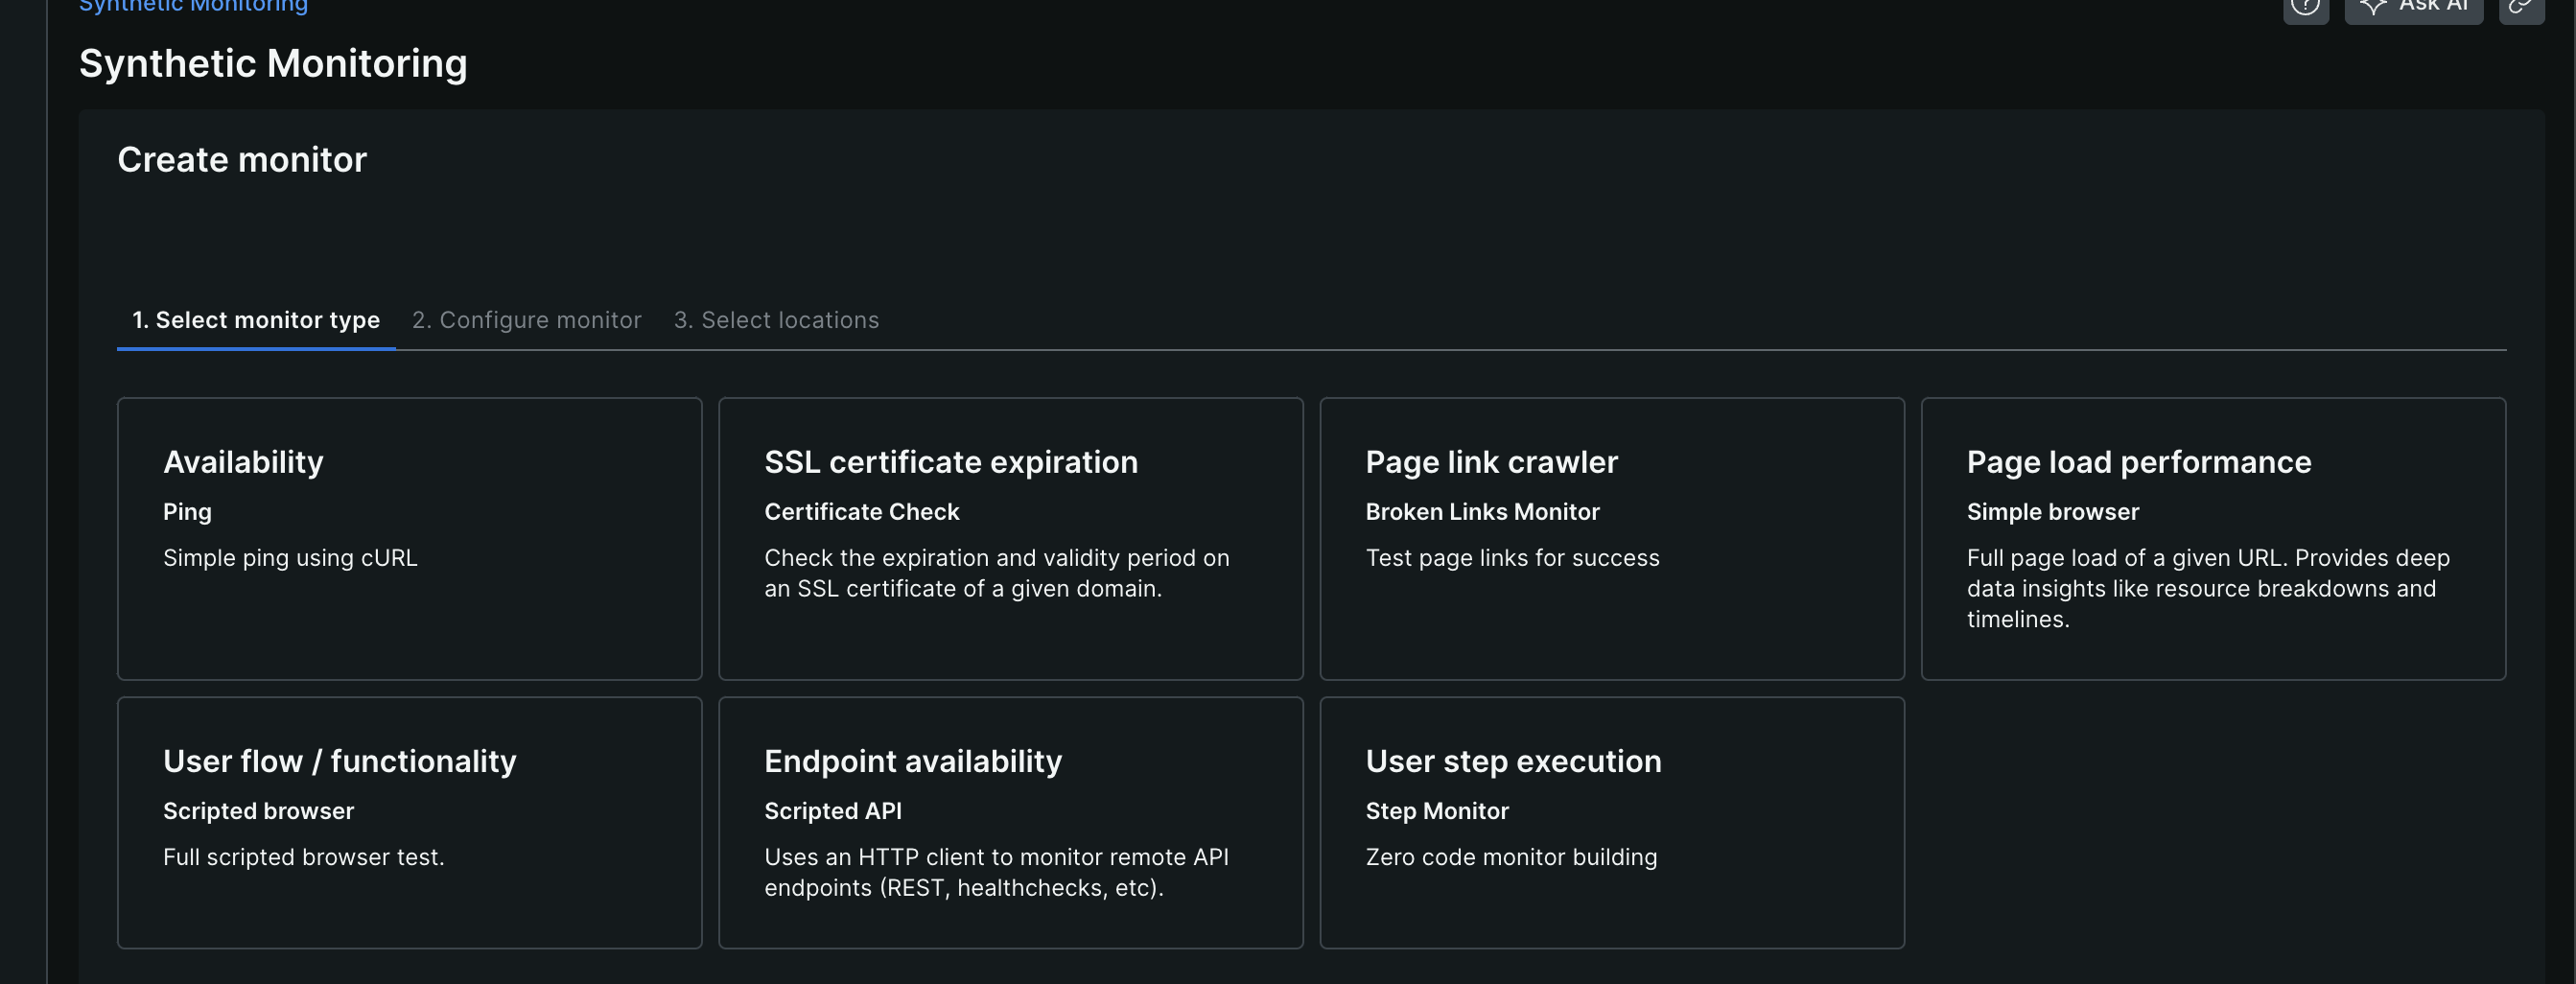
SELECT count(*) FROM PageAction FACET restaurant - we can create “synthetic monitors” as discussed here. we need to provide locations to run these from, the frequency to run these monitors on, etc
- they can be as simple as “availability” (ping), or we can run complex logic using “scripted browser monitor”. i think for scripted browser monitor, we need to provide a script that interfaces with “webdriverjs”
![]()
- “apdex” - stands for “application performance index”. it measures the satisfaction of users
- it is between 0 and 1. a score of 1 might actually mean our thresholds are too high, and we need to reduce them. a good apdex score is between 0.9-0.95
- say threshold is t. transactions <= t are satisfied, > 4t are frustrated and in between the two are tolerating
- so, apdex = ((satisfied requests) + (tolerating requests / 2)) / (total requests)
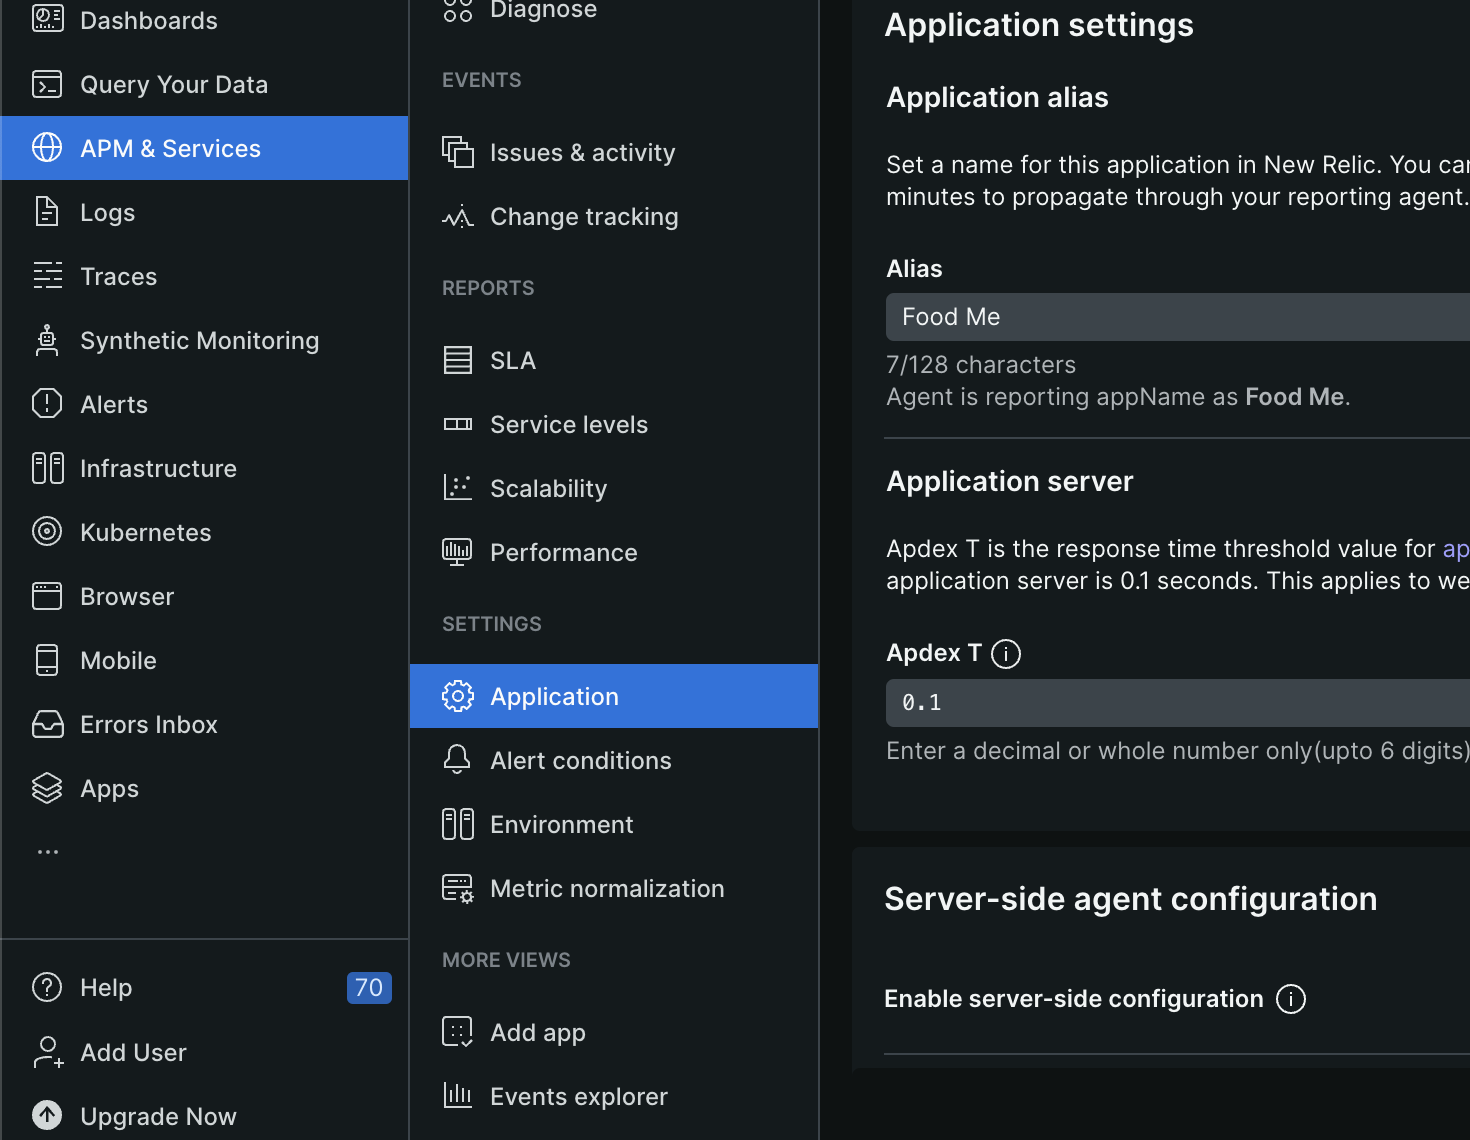
- we can configure the apdex threshold from “APM & Services” -> select the application -> “Application”
![]()
- my understanding - what if we get back a 500 response code very fast? is it considered “satisfied” by apdex, thus increasing our apdex and giving us a false sense of security? - no, apdex classes errors as frustrated as well
OpenTelemetry
- opentelemetry is a vendor neutral data collection standard
- this allows us to instrument first and choose our “observability backend” later
- note - how new relic stores data from opentelemetry agents vs its proprietary agents is different. because of this, the underlying nrql queries used for the visualizations we see by default change as well
- “otel specification” - specification is a document that highlights how the core components should be developed. e.g. in case of otel, this helps us implement it across languages in a standardized manner
- “otel api” - used to for e.g. “generate melt data”
- “otel sdk” is the implementation of otel api. otel sdk helps us “configure otel” in our environment
- “otel collector” - how data is “received”, “processed” and “exported” to the observability backend. we can have the “otel sdk” forward it to the observability backend directly, but this approach is not recommended at scale. using an otel collector also helps us configure retries, batching, encryption in the collector and avoid this overhead in the application itself
- “manual instrumentation” can be done by adding “custom attributes” to spans etc
Infrastructure Monitoring
- recap of features -
- host resources and processes
- log forwarding
- cloud integration - for major cloud providers
- on host integration - for docker, k8s, etc
- new relic has “guided installs” for most things. e.g. for say an ubuntu vm, we install the “new relic cli” and the “infrastructure agent”
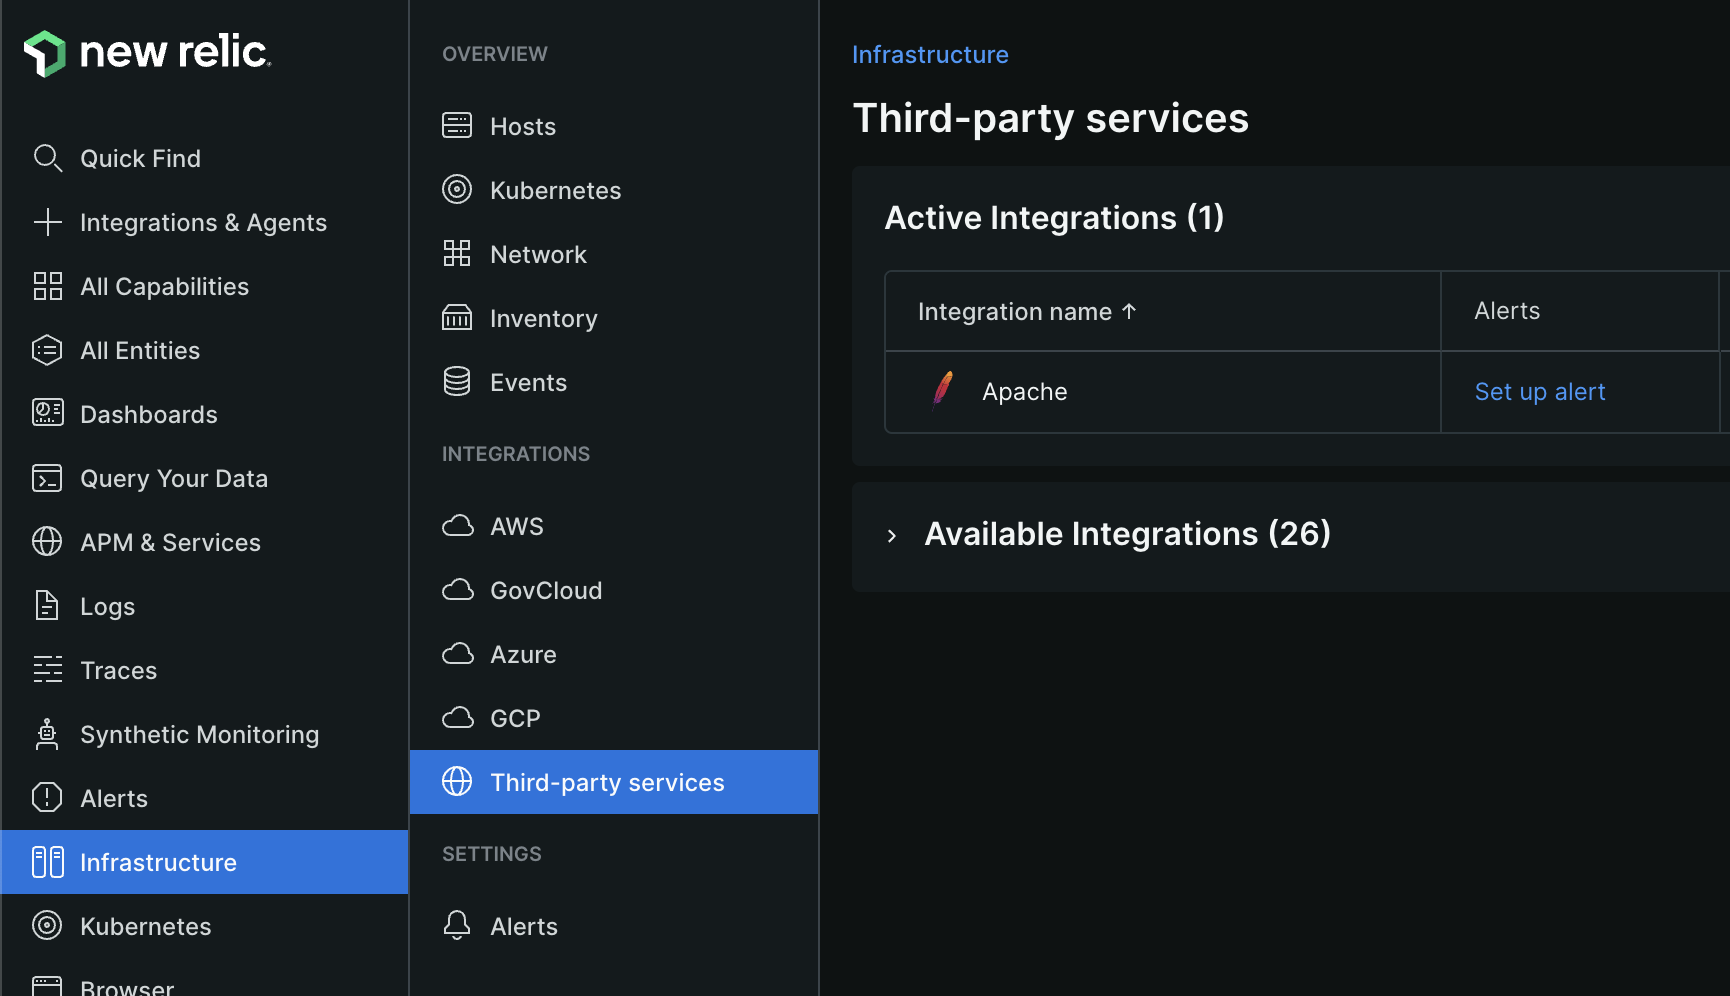
- the new relic infrastructure agent can “auto discover” the applications and logs in our environment. e.g. my vm had the apache web server configured, and new relic could automatically detected this. it was visible under the “third part services” tab -
![]()
- for kubernetes, there is a new relic helm chart which we can to install in our clusters in order to monitor all the applications etc in it
- apparently, new relic can also correlate the “apm transactions” of the applications present in the kubernetes cluster. i can see the different deployments here under the “apm & services” tab
Alerts
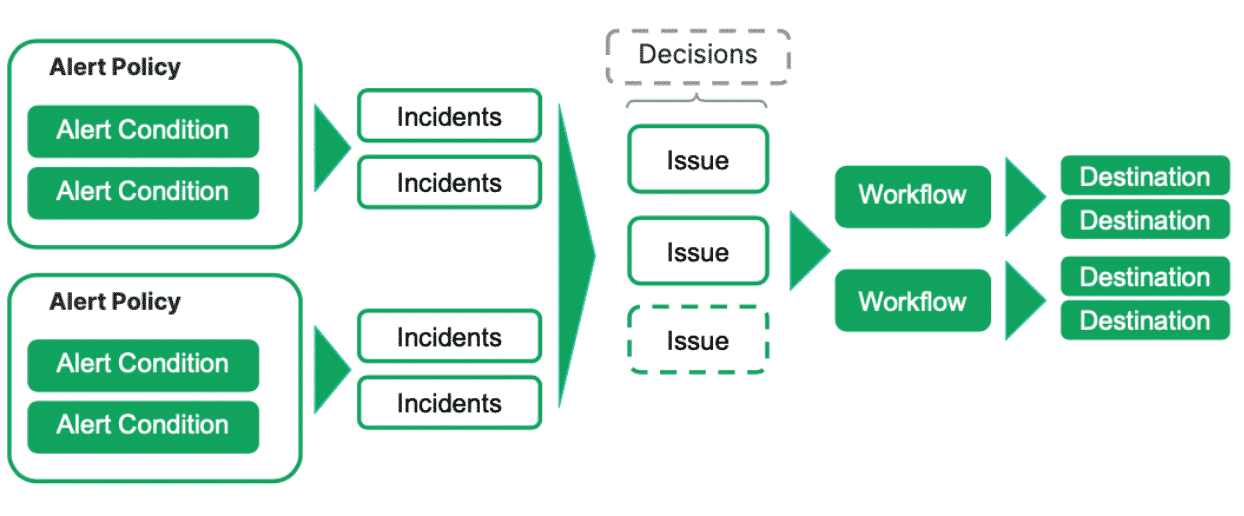
- “alert policy” - organize “alert conditions” and define “issue” preferences, e.g. enable issue correlation
- “alert conditions” - monitor data sources and create “incidents” when the behavior crosses a “threshold”
- “incidents” - created when “alert condition” “thresholds” are breached. they contain the individual state, and are grouped into “issues”
- “issues” - group of one or more “incidents”. they determine when users are “notified”
- “decisions” - correlate “issues” using intelligence. this helps reduce noise
- “destination” - communication channels, e.g. webhooks, pager duty, etc
- “workflows” - help with “notifications”
- they map “issues” to “destinations”
- they also control what data gets sent in this notification, using templated syntax
- they enable many to many relationship between “issues” and “destinations”
Creating Alert Condition
- i selected the “guided install” option when creating an “alert condition”
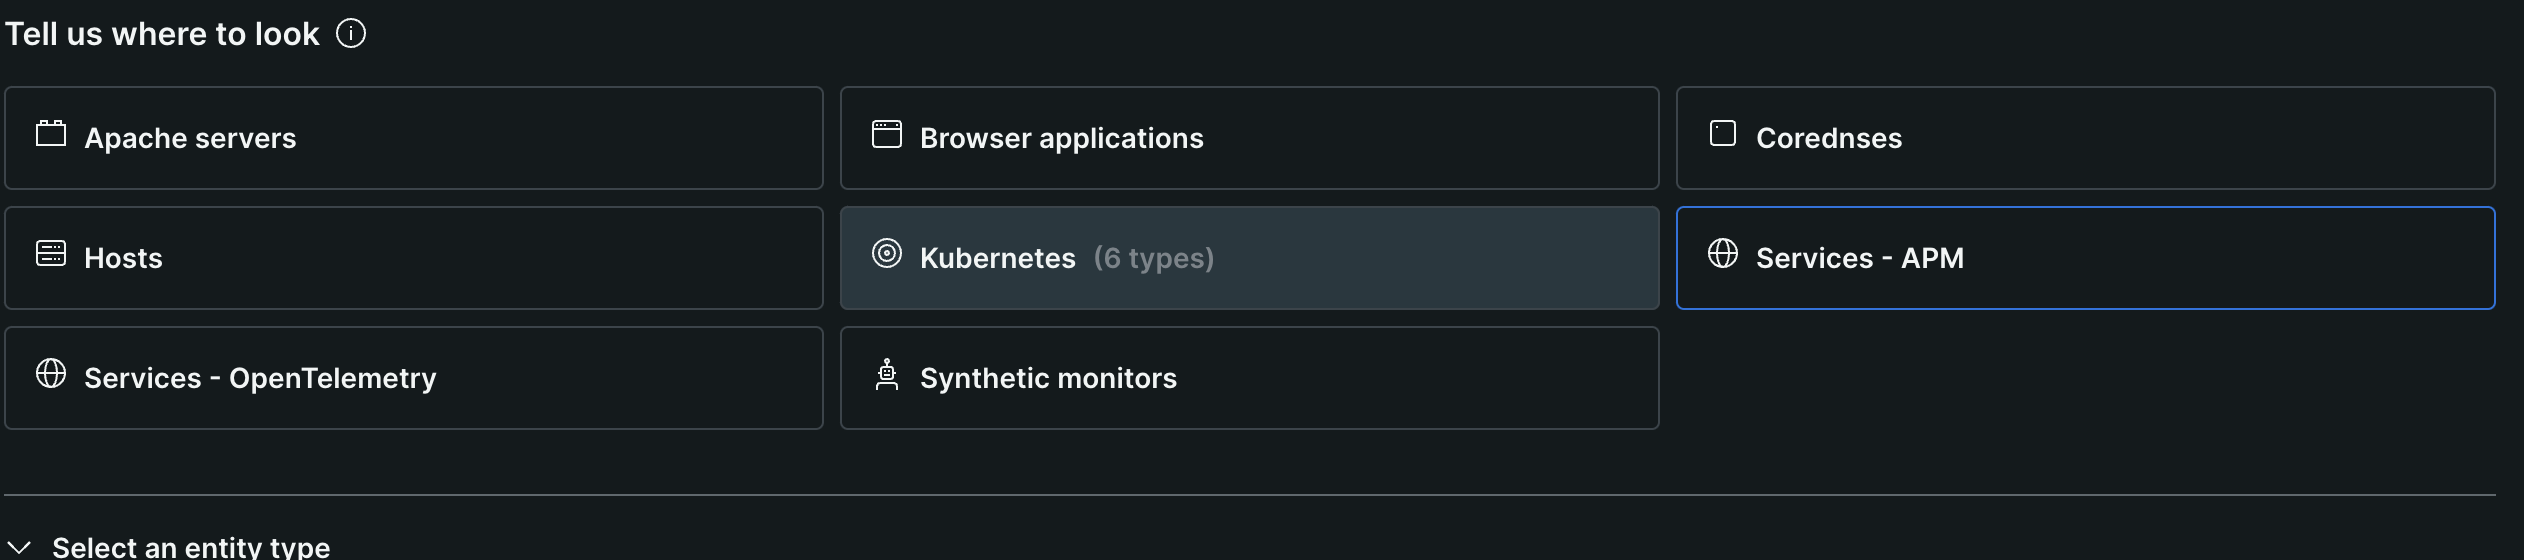
- first, we need to select what to monitor. here, we choose one of “services - apm”, “hosts”, etc
![]()
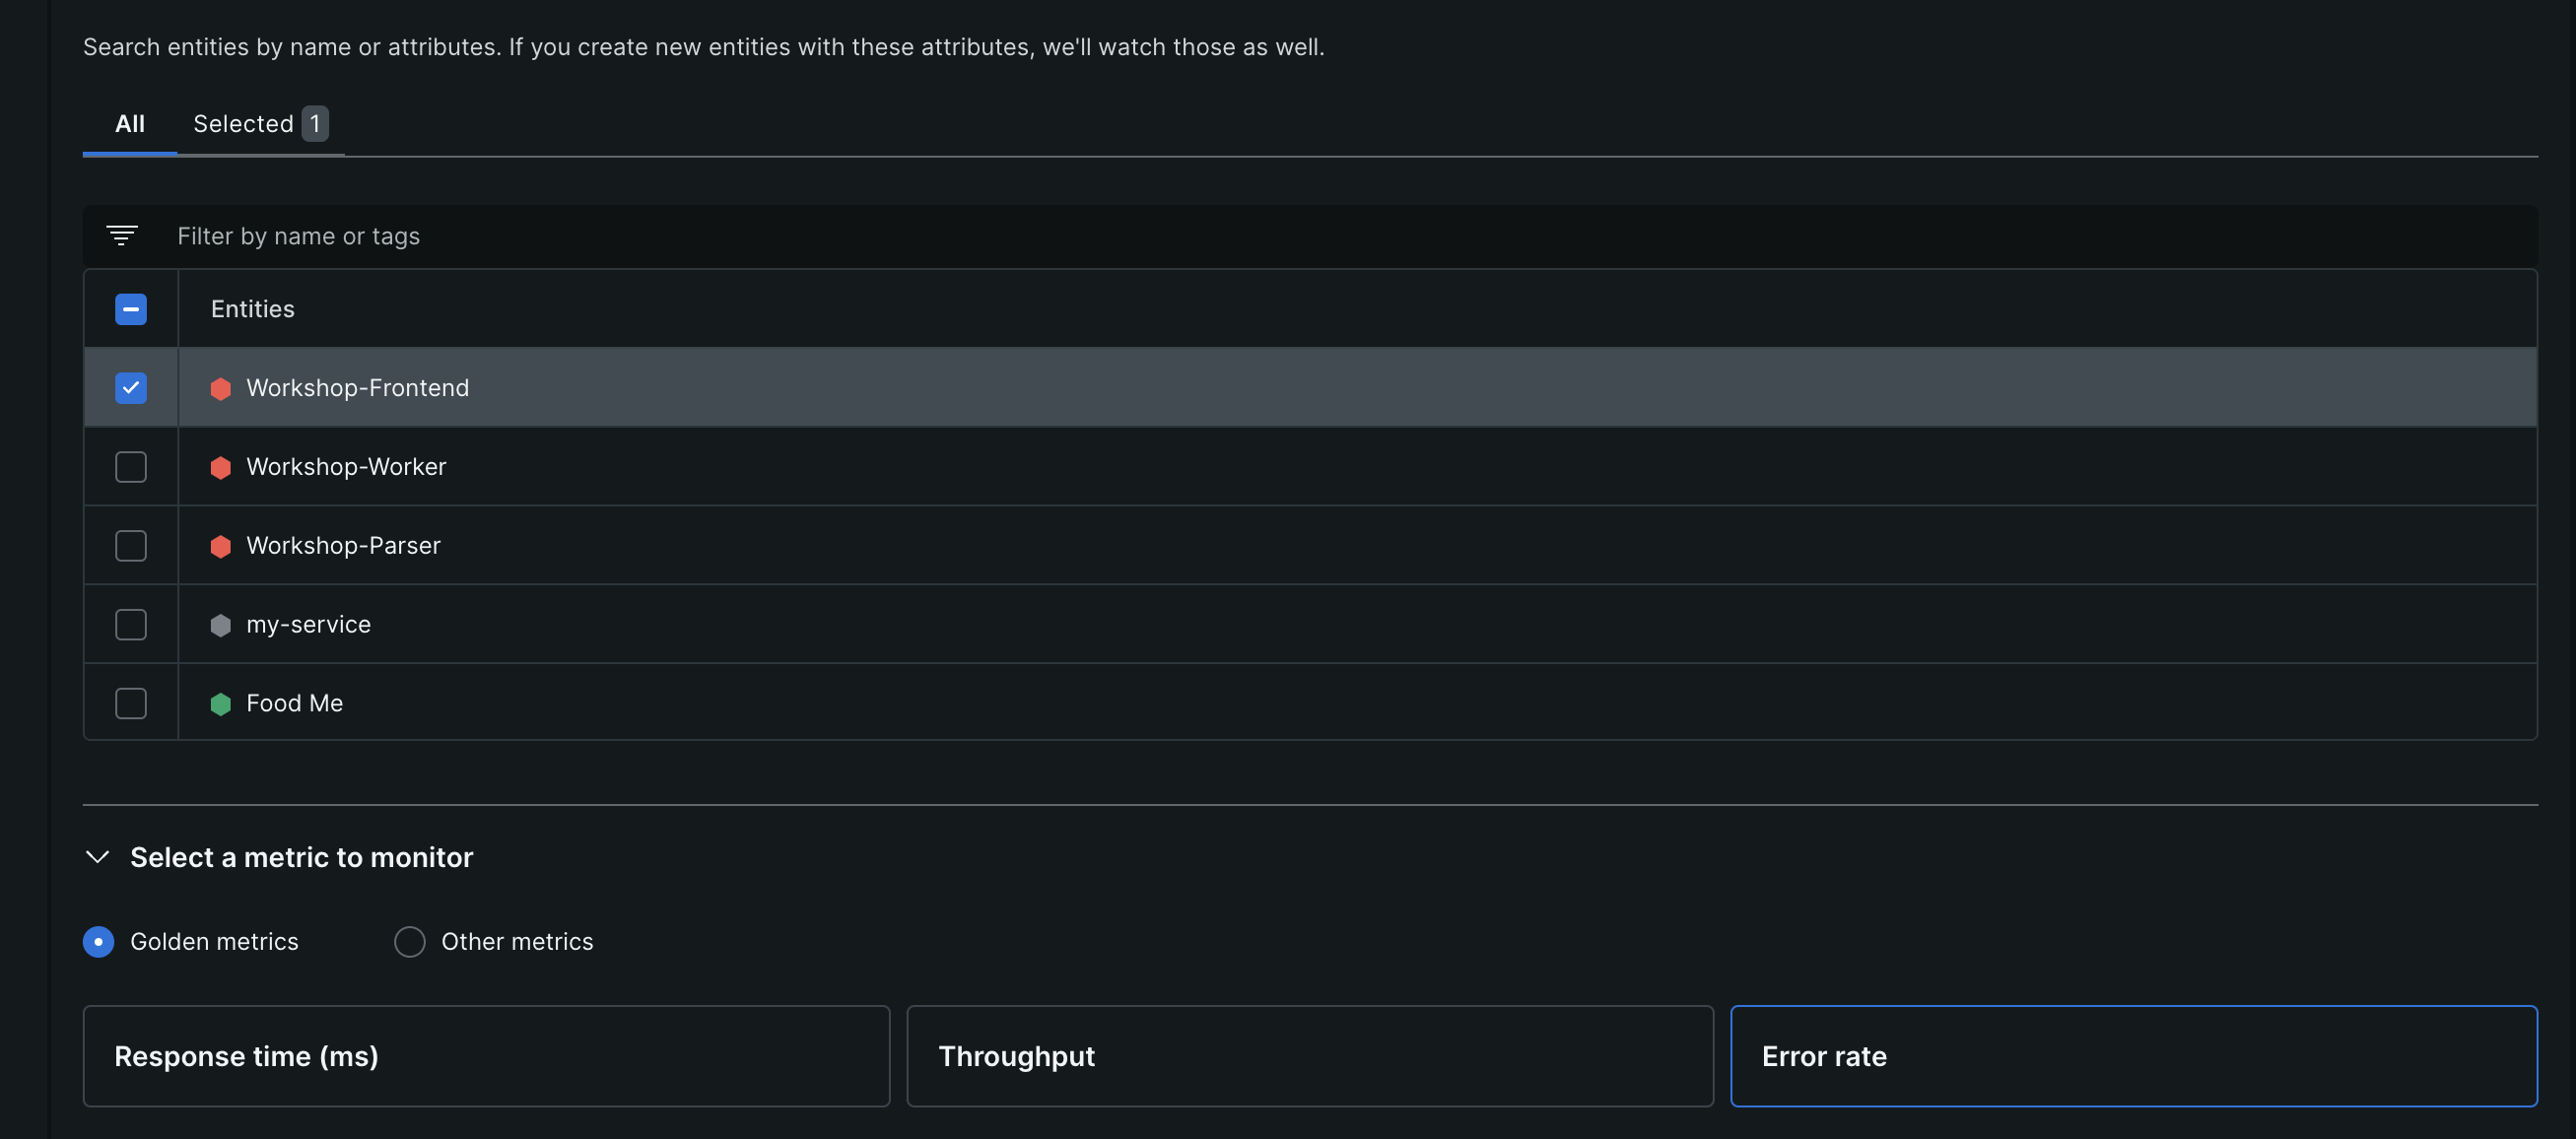
- then, we select the particular entity / entities to monitor
- then, we select the metric to monitor - cpu percent, throughput, error rate, etc
![]()
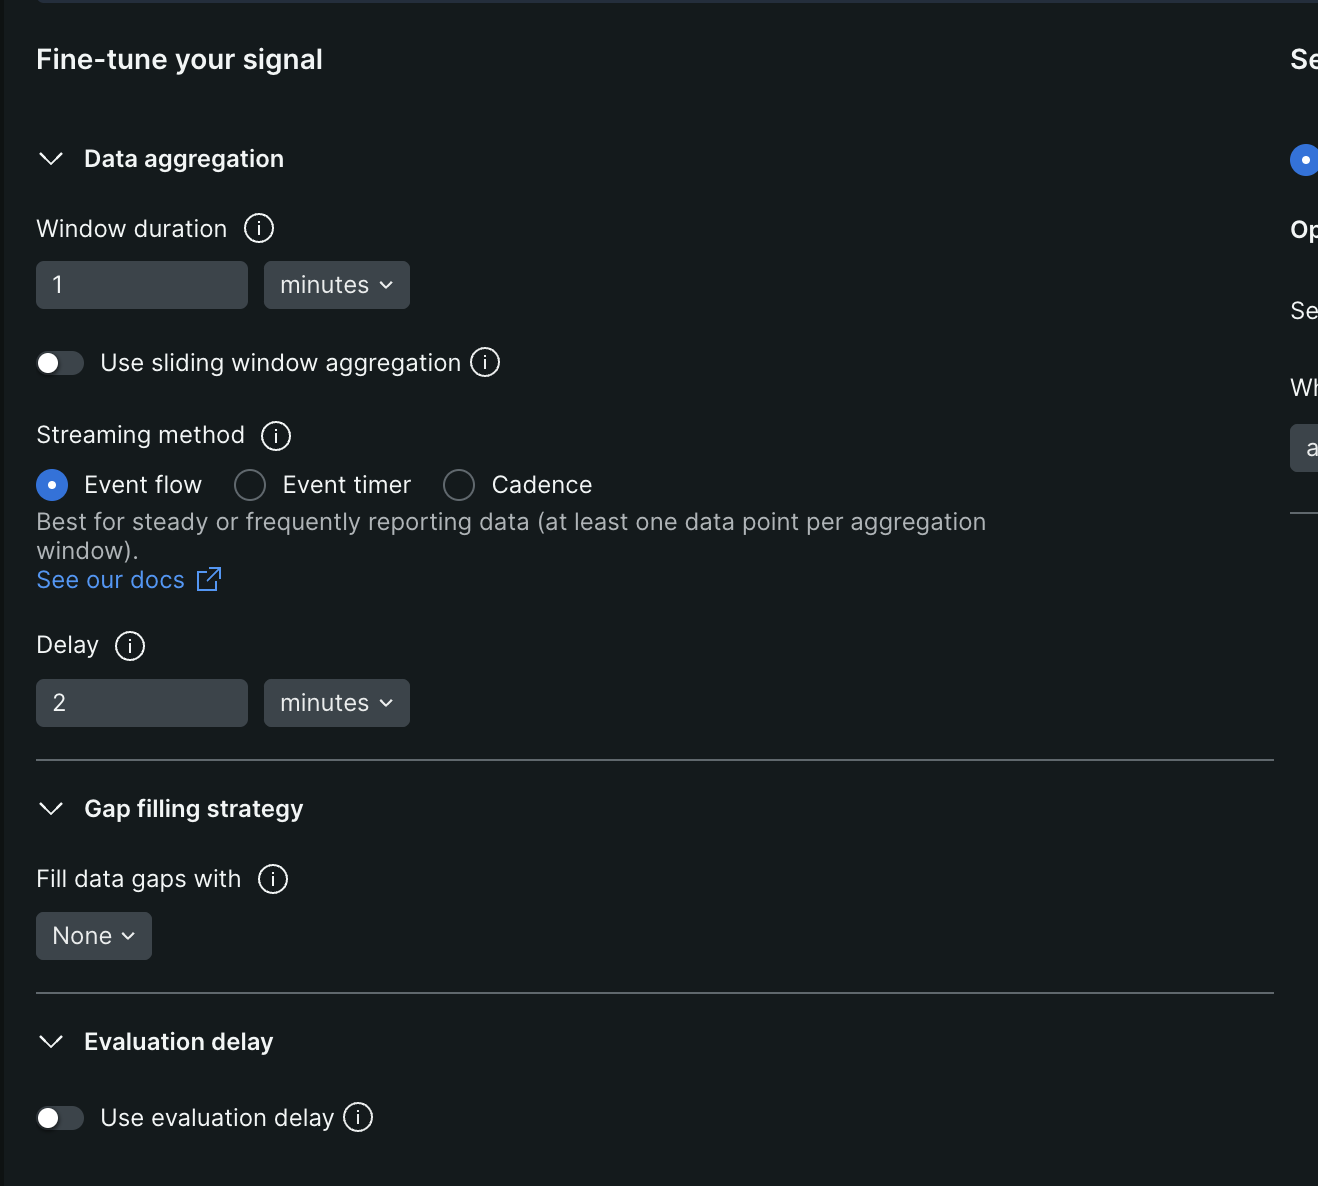
- now, we “fine tune the signal” using the inputs described below
![]()
- “window duration” - we can configure this value based on the frequency at which the data source receives data
- 1 minute for page views
- 1 hour for hourly signals
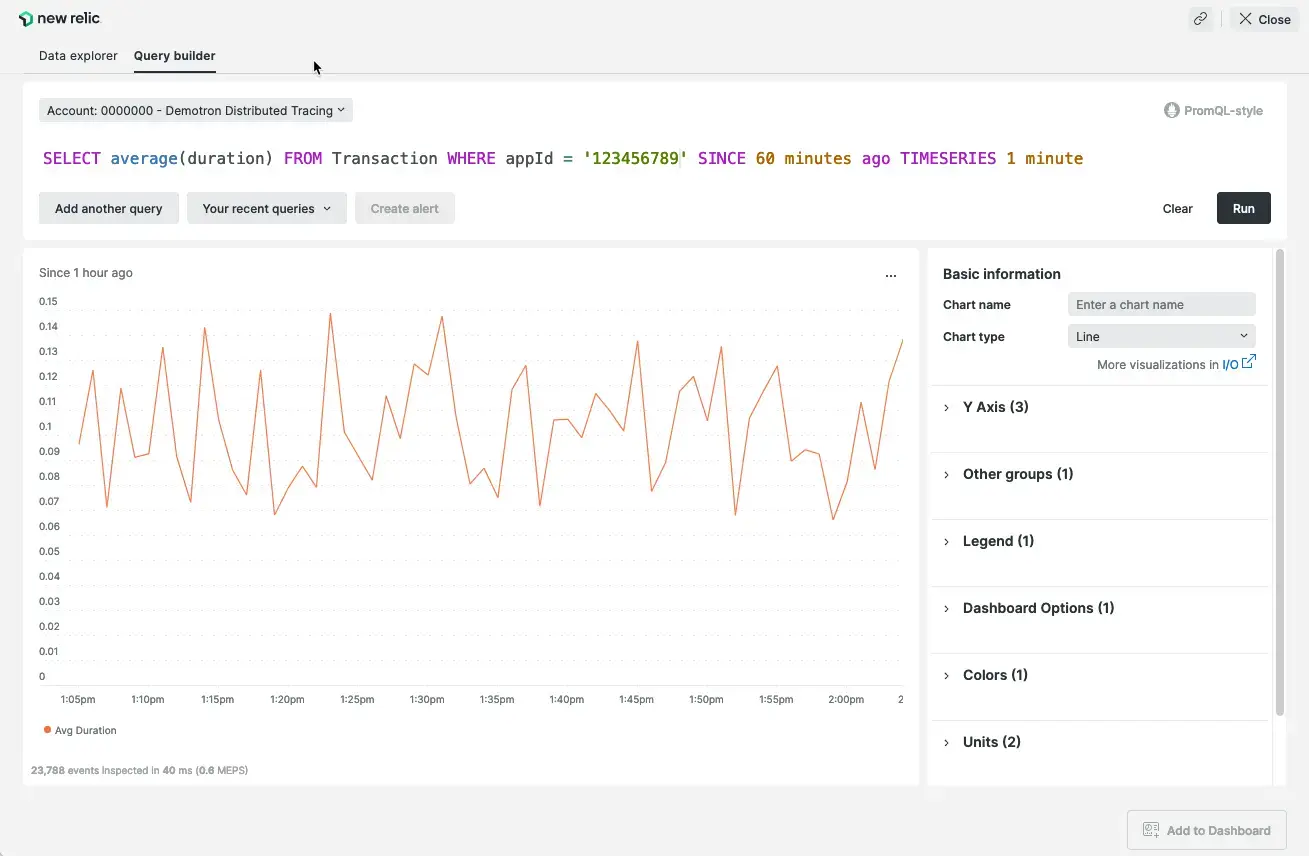
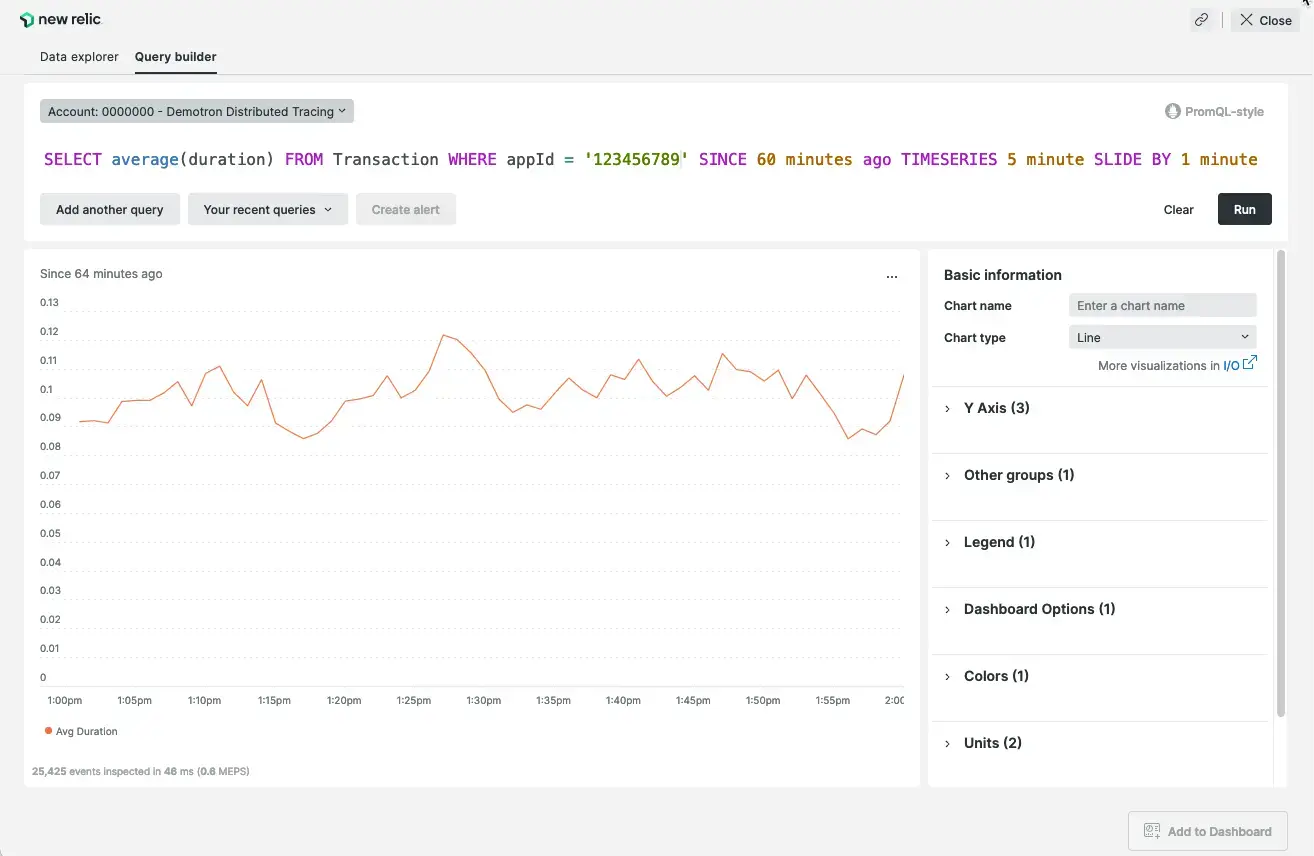
- we can configure it to use “sliding window aggregation”. it helps smoothen out graphs with a lot of spikes. the idea is we increase the window duration, but to avoid delays, we keep a small sliding window. e.g. “timeseries 1 minute” becomes “timeseries 5 minutes slide by 1 minute”
![]()
![]()
- then, we choose the “streaming method”
- use “event flow” for steady and frequent signals, having one or more data points per aggregation window
- use “event timer” for sparse, inconsistent signals, having one or fewer data points per aggregation window
- then, there is a “delay” that we configure. i think this is basically like the watermark feature of spark
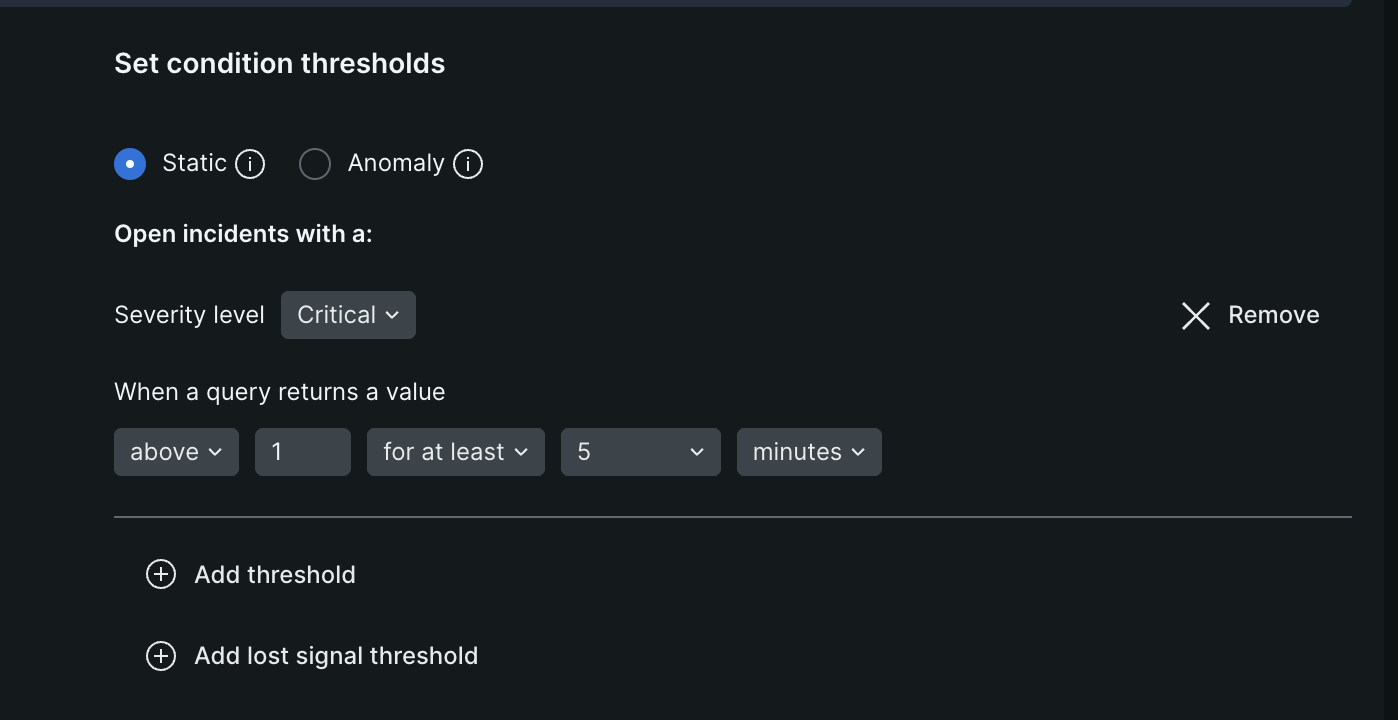
- after the above, we “set the alert condition thresholds”
![]()
- we can choose “static” or “anomaly” for our alert condition threshold
- using static, we can say that use a severity level of “warning” if our query returns a value of 2 in at least 5 minutes, and use a severity level of “critical” if our query returns a value of 5 in at least 10 minutes
- however, when we use anomaly, this is my understanding of what happens - we say that we would like to create incidents when the value goes above or below the “baseline” prediction. the baseline will adjust based on patterns dynamically, and we configure how much deviation from this baseline we can tolerate
- “loss of signal threshold” - e.g. an alert condition uses
countto track the number of events received. the condition is not triggered when the event count drops to zero because the nrql query returns null instead of 0. so, we can add a “loss of signal threshold” to the alert condition. if the signal is lost for 10 minutes, it will trigger a violation and open an incident, regardless of the actual count value - finally, we connect this alert condition to an “alert policy”, give it a name, description, etc and hit save
- this creates an alert condition for us
- the incident is closed automatically if the conditions do not breach the thresholds for the specified durations. however, we can also specify the value where open incidents close irrespective (i think of it like a timeout)
- refer here how for reducing costs of “automated ccu”, we should use filtering using
where - best practice - we can send critical alerts to pager duty and less critical warnings to slack channel
- we need to take care of “noise” and “flap” when setting up alerts
- do not alert on a single failure, alert for e.g. after three consecutive failures
- “flap” - incidents are rapidly opened and closed because the metric hovers around the threshold. solution - create an alert only if the condition has been met for a sustained period like 15 minutes
- i think we can leverage decisions for this as well
Issues
- recall that “alert policy” determines how to group “incidents” into an “issue”
- an “incident” is created every time the “alert condition” “threshold” is breached
- so, we can choose from the following three options when creating an alert policy
- “one issue per policy” - group all incidents for this policy into one open issue at a time
- “one issue per condition” - group incidents from each condition into a separate issue
- “one issue per condition and signal” - group incidents sharing the same condition and signal into an issue
- the idea is that when we get an issue, we acknowledge it
- this sends a notification to our teammates, that tells them that we are looking into it
- notifications are sent out every time an issue is “opened”, “acknowledged” or “closed”, and this behavior can be adjusted in the workflow settings
- there is a “root cause analysis” section in the issue, which tells us if new relic finds any deployments, error logs, any metrics like response time, etc related to the issue
- new relic can use intelligence to correlate issues using “decisions” to reduce noise
- decisions can be custom as well
Predictive Alerts
- it helps with proactive monitoring
- it tries forecasting values, and if these predictions breach the thresholds we define, we get alerted
- it tries to identify “seasonality” in our data i.e. repeating patterns
- it can look for different “seasonal lengths” - hourly, daily, weekly
- to start predicting, it needs at least 3 “cycles” of data - e.g. 3 hours or 3 days of data etc
- if the algorithm cannot find a pattern, it automatically switches to a non seasonal model, and tries predicting based on the most recent values it sees in the data
- we can choose between different kinds of behaviors - e.g. if the breach actually happens, we can close the original incident created due to prediction and create a new one created due to the actual breach, or continue with the original predicted incident itself
- we can make it so that the entities part of the alert condition are not marked unhealthy. we are forecasting, and marking an instance unhealthy based on forecasted value might not be right, health should reflect the current state
Pricing
- “new relic compute” - consumption based pricing model
- “core compute” - for “full stack observability”. e.g. apm, browser and infrastructure monitoring
- “advanced compute” - for “intelligent observability”. e.g. codestream, new relic ai, etc. helps us go from “reactive monitoring” to “proactive monitoring”
- compute is measured using “ccu” or “compute capacity unit”
- it is consumed when a customer initiated action is successfully completed - e.g. loading a page, executing a query, etc
- ccu is not consumed for scenarios like -
- unsuccessful queries
- when a new relic account team professional is working with you on the platform
- the idea is that all users in an organization get unlimited access to all platform features. my understanding - this is needed because earlier pricing models used to divide pricing depending on number and type of users, e.g. “basic users” who can view dashboards and run queries, “core users” who can use features like codestream, etc
- how new relic works -
- data is ingested from various sources - infrastructure, kubernetes, apm, browser, etc
- this ingested data is then bifurcated into two parts as described below
- part 1 - “alerts engine” - data is filtered and aggregated into windows for alerts, service level metrics, etc
- part 2 - “nrdb” - the data gets stored in different tables in nrdb. after this, the user can query the data using nrql, dashboards, etc
- part 1 is called as “automated ccu”, since they do not have a user associated with them. e.g. evaluation of alerts
- part 2 is called as “active ccu”, since they occur when a user interacts e.g. using nrql
- “compute budgets” - set a monthly limit and receive alerts when ccu reaches a certain threshold
- “compute optimizer” - recommendations around how to optimize inefficient queries and alerts
- best practices for “automated ccu” -
- remove duplicate / obsolete alerts
filter()aggregator loads all the data into the query engine first before, whilewhereonly pulls the relevant data from the beginning of the query process. hence, we should usewherewhen possible- “sliding window aggregation” tends to be more expensive in terms of ccu consumption
- when defining “service levels”, pull “bad” instead of “good” events. this way, the amount of data to pull would be significantly less (e.g. typically, slo would be 99%, so we would only have to pull 1% of data that way)
- synthetic monitors too should be written optimally. avoid hardcoded sleeps, use
waitForElementVisibleinstead. deploy monitors on fewer locations / shorter frequencies when possible
- best practices for “advanced ccu” -
- note - unlike in automated ccu, where and filter do not matter, since they are applied after data retrieval
- however the
sincefilters do matter, so we should always restrict the time windows to as low as possible - we should be mindful of the same thing i.e. selecting the time window from top right when loading curated views like the apm summary screen
- while we might loose on some granularity, metrics are much more efficient to query than raw events. events-to-metrics tool can be used to create custom metrics that can then be queried over long durations
- we can find a “month to date” usage tracker under our user name -> administration -> usage summary
- we can view details for compute under our user name -> administration -> compute management
- in “compute management”, we can see details as which user / team / sub account / which new relic feature is driving the most ccu
- “compute optimizer” helps us identify and fix inefficiencies and “compute budgets” help us manage and control our spend
- compute usage event types -
NrMTDConsumption- high level overview of cumulative month to date usageNrConsumption- detailed breakdown of ccu by capability, user, sub account, etcNrComputeUsage- granular, minute by minute breakdown of ccu consumptionNrdbQuery- detailed information about every query run on your account
- note - we are “not” billed when querying these event tables. this helps new relic ensure cost transparency
- example of query -
FROM NrComputeUsage SELECT sum(usage) AS CCU WHERE dimension_query IS NOT NULL FACET dimension_query, dimension_email, dimension_productCapability SINCE 1 month ago LIMIT MAX - explanation for the query -
NrComputeUsage- the granular minute by minute data consumption- we sum the usage
- filter - only analyze usage generated by queries
- group the results by the actual query, the user who ran the query, and the product or feature (dashboards, alerts, etc)
Synthetics
- traditionally, people rely on “reactive monitoring”. example of this - “rum” or “real user monitoring” analyzes data from actual users to show how our application is performing in the real world
- issue - we discover problems after users have already experienced them
- “synthetics” - automated scripts to monitor websites, applications, api endpoints, etc by simulating user traffic
- every application has “critical user paths”. e.g. logging in, adding items to the cart and checkout for an e-commerce website. businesses need to monitor these flows and ensure they are always working as expected
- it can also act as “smoke testing” after a new deployment is made
- there are different kinds of synthetic monitors we can create -
- “availability monitors” - is the application accessible?
- “ping monitor” - lightweight and fast checks, to ensure website is available
- “certificate check” - proactively check expiration of ssl / tls certificates
- “performance monitors” - is it fast enough?
- “simple browser monitor” - uses a full featured browser like chrome and loads the css, js and images
- “functionality monitors” - can customers use our features?
- “scripted browser” - use selenium for a complete user journey
- “step monitor” - same but requires zero coding
- “scripted api monitor” - make requests to apis, validate status codes, verify data in response body
- “broken links monitor” - broken links often lead to frustrating experiences for end users. this monitor crawls a url and tests all the links on that page to ensure none of them are broken
- “availability monitors” - is the application accessible?
- for every synthetic monitor, we have different screens to look at -
- “summary” - provides a comprehensive overview of the monitor from various global locations
- “results” - details every individual run for a monitor, allowing us to troubleshoot
- “resources” - analyzes every individual asset like images and scripts to identify which resources are impacting page load times and user experience
- basically, two events are used underneath -
SyntheticCheckfor high level dataSyntheticRequestfor detailed performance analysis
- note - synthetic monitors also include automatic retry logic of 2 times, before marking a resource as failed
- we can setup alerts using nrql as follows -
- alerting on failures -
SELECT filter(count(*), WHERE result = 'FAILED') FROM SyntheticCheck WHERE monitorName = 'My Critical Monitor' - alerting on performance degradation -
SELECT average(duration)
FROM SyntheticCheck
WHERE monitorName = 'My Critical Monitor'
- alerting on failures -
- new relic provides a global network of “public locations” we can run our synthetic monitors from
- for monitoring internal applications, we can also setup “private locations”. we run “synthetic job managers” using docker or kubernetes in our network infrastructure, which then runs the synthetic monitors for us
- frequency can be configured to as low as every minute or as high as once a day
- note - this is configured per location i.e. if we have three locations and the frequency of the monitor is 1 per minute, our application receives a total of three requests per minute
- we can configure “monitor downtime” to pause monitors - either on a recurring schedule or as a one time event. this helps avoid alert fatigue and preserves sla metrics during planned maintenance
- “secure credentials” - for critical user journeys like logging in that require a username and a password. we can set them up and reference them in our script like so -
$secure.WEB_PW - the nodejs runtime has access to libraries like aws, lodash, etc. we can find the full list here
Service Level Management
- terminology to help bridge the gap between engineers and stakeholders
- “service levels” - measure “indicators” against “objectives” for expected performance
- “service level management” - reporting the service levels
- for service levels, the things should be measurable
- “service level indicator (sli)” - typically percentage of successful events (good events over valid events) over a period of time (e.g. one hour, one day, etc)
- “service level objective (slo)” - expected service level of a system (or expected percentage of successful events based on our above explanation of sli)
- “error budget” - how much we are allowed to fail before we are considered “out of compliance”
- “service boundary” - endpoint where the consumer connects to make requests
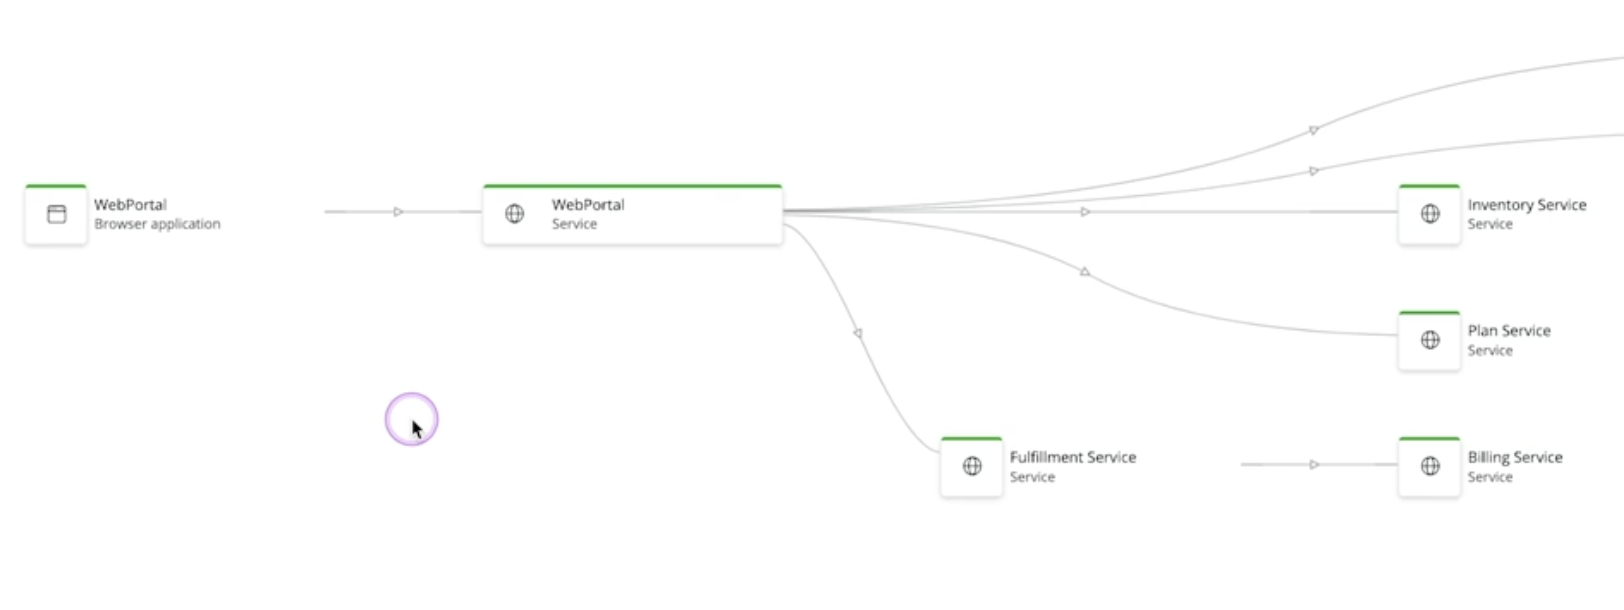
- we need to identify the service boundary first. e.g. refer the service map below. while users interact with the web portal browser / mobile application (far left), our service boundary is actually the web portal service (second left)
![]()
- once we identify the service boundary, we need to identify the “baseline”. typical examples -
- non error transactions / success
FROM Transaction SELECT percentage(count(*), WHERE error is false) AS 'SUCCESS_RATE' WHERE appName = 'data-portal-telemetrygen-backend (staging.stg-teeny-toes)' FACET name SINCE 1 WEEK AGO - response time (latency)
FROM Transaction
SELECT percentile(duration, 95) AS 'LATENCY'
WHERE appName = 'data-portal-telemetrygen-backend (staging.stg-teeny-toes)'
SINCE 1 WEEK AGO
- non error transactions / success
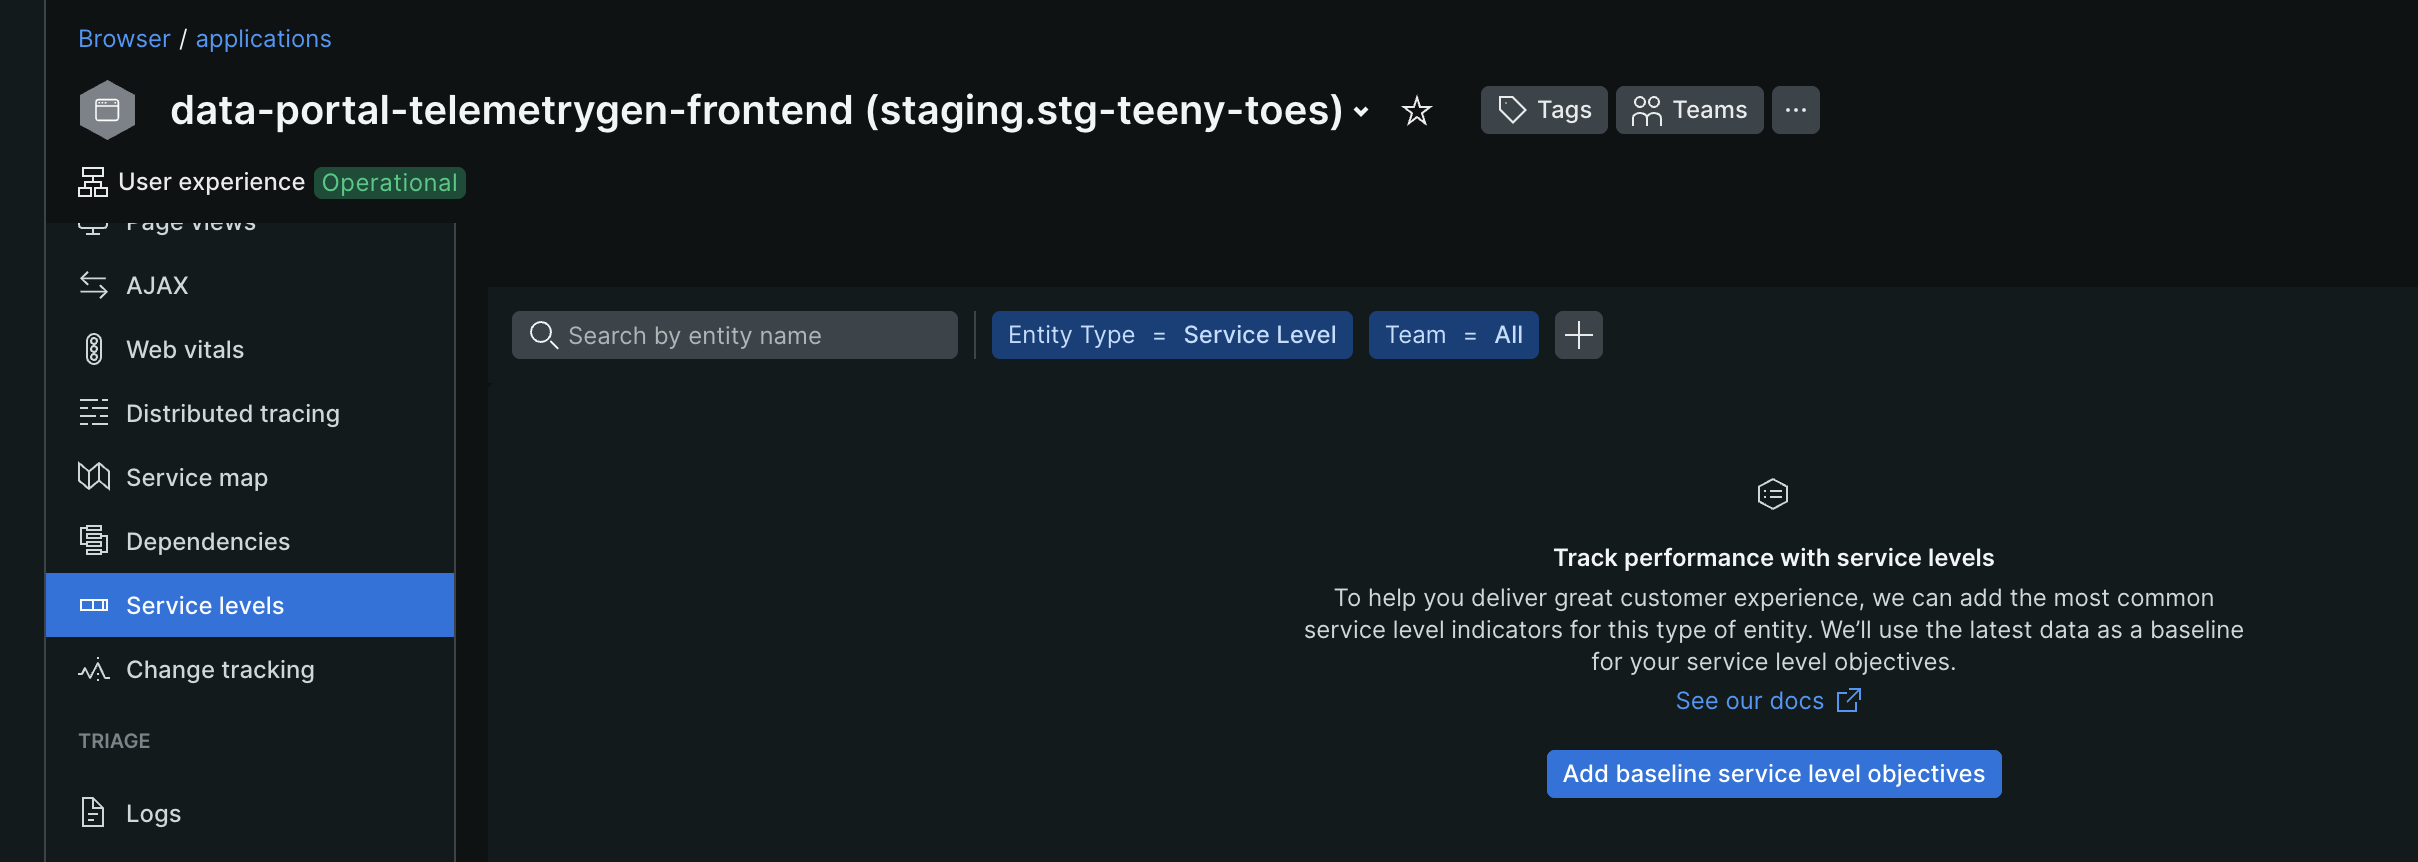
- while we know the underlying logic, new relic can automatically add these for us as well for both browser and apm. we just need to click on “Add baseline service level objectives”
![]()
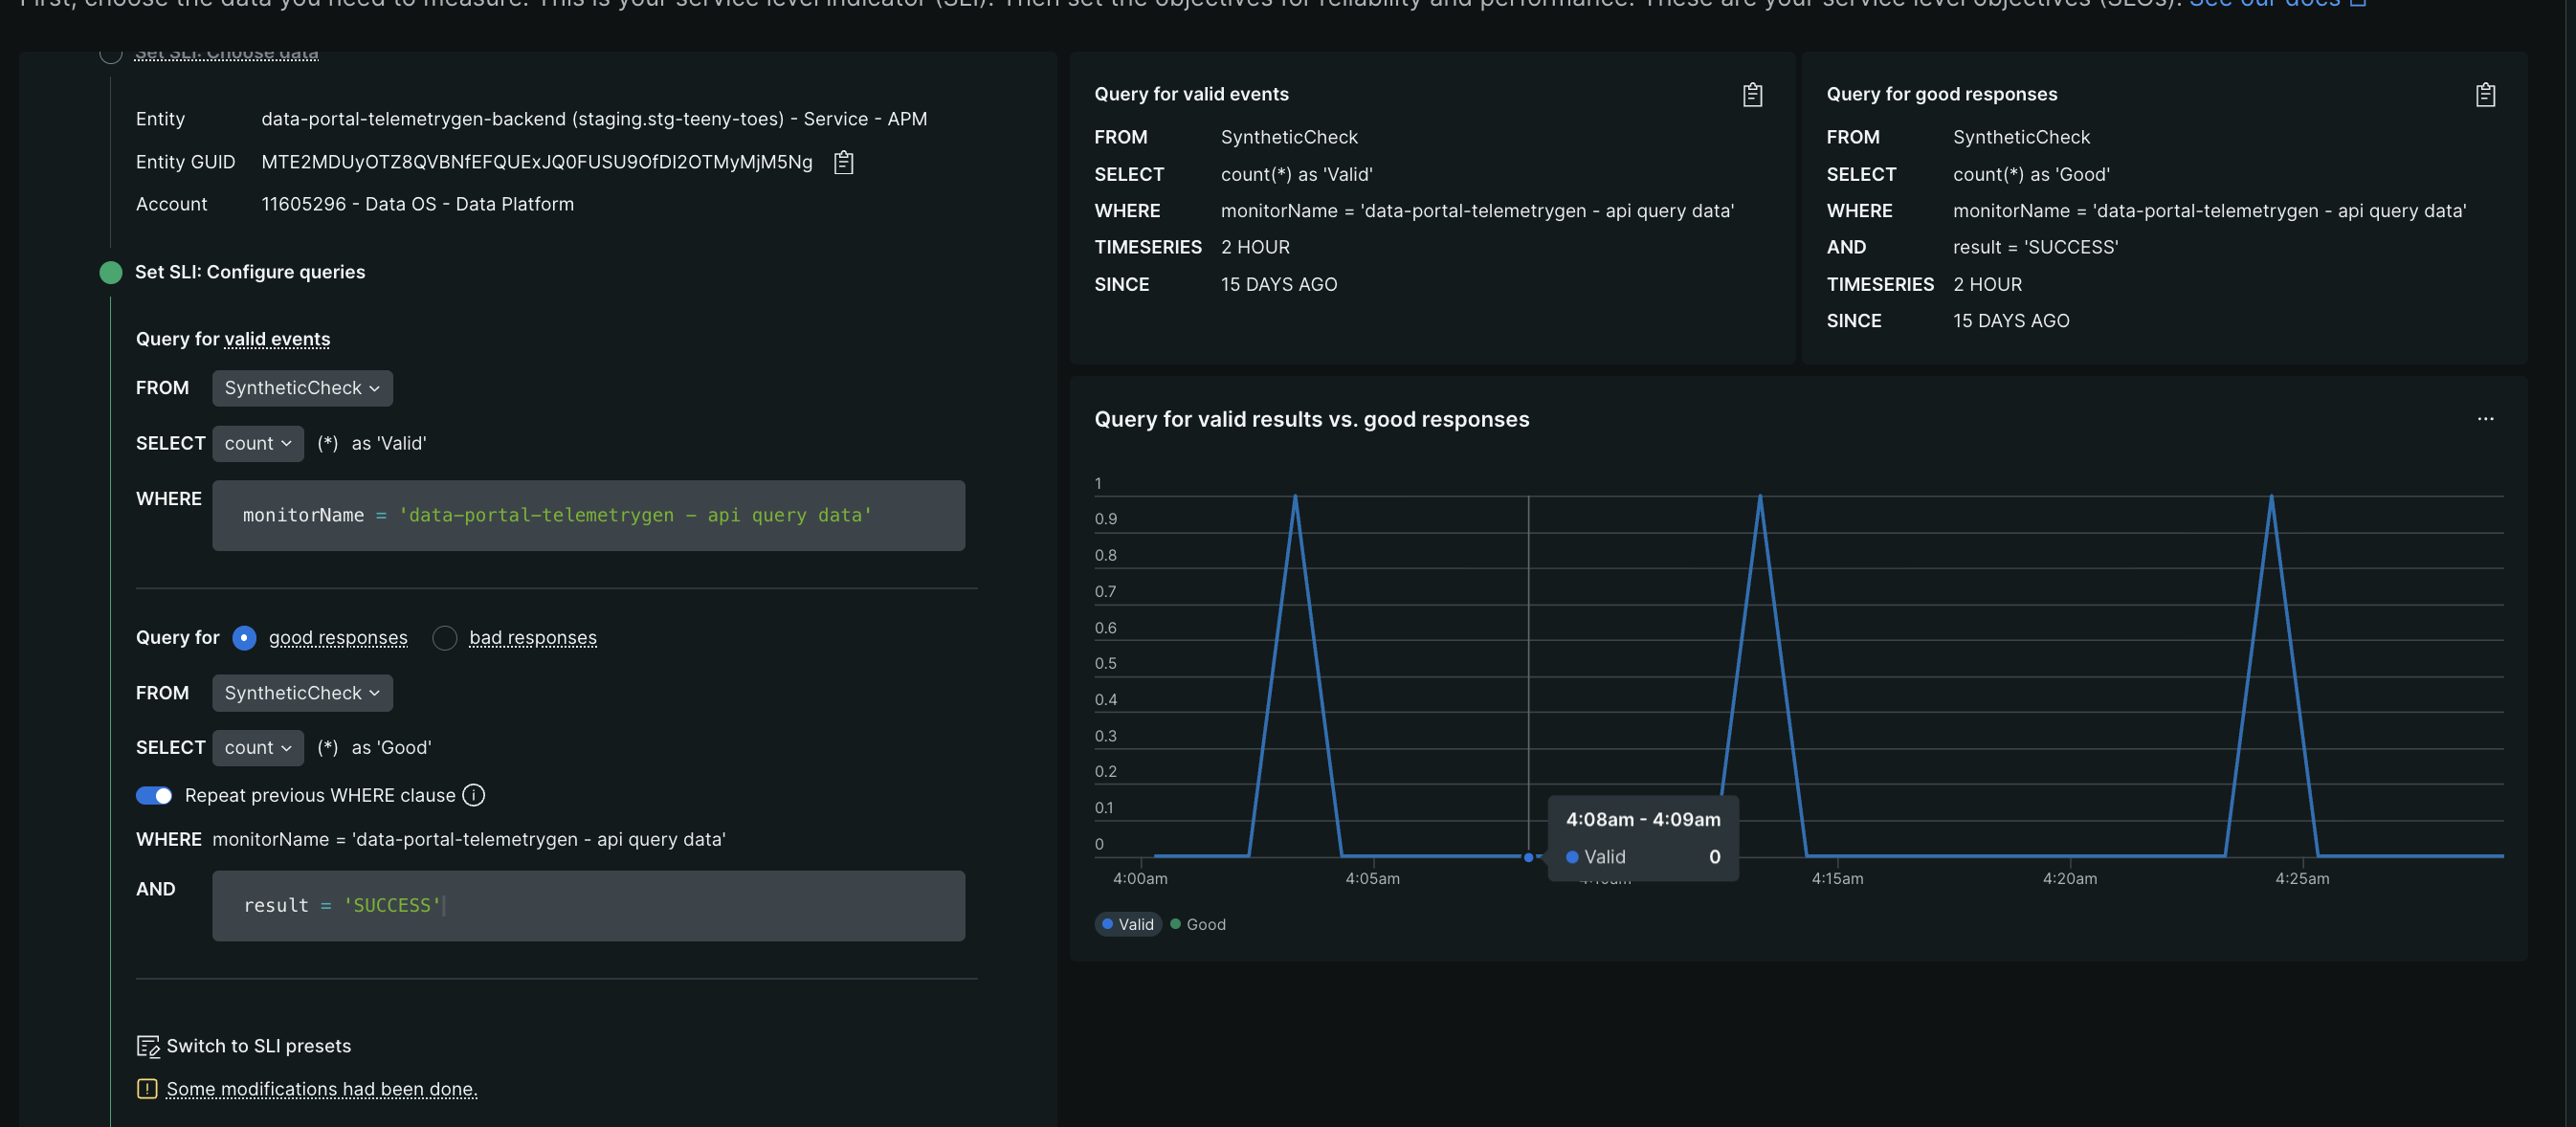
- “input performance service level” - things like loading the page, calling an endpoint, etc. in new relic, we first create synthetic monitors for such actions. then using new relic, we create “service level indicators” for these synthetic monitors
![]()
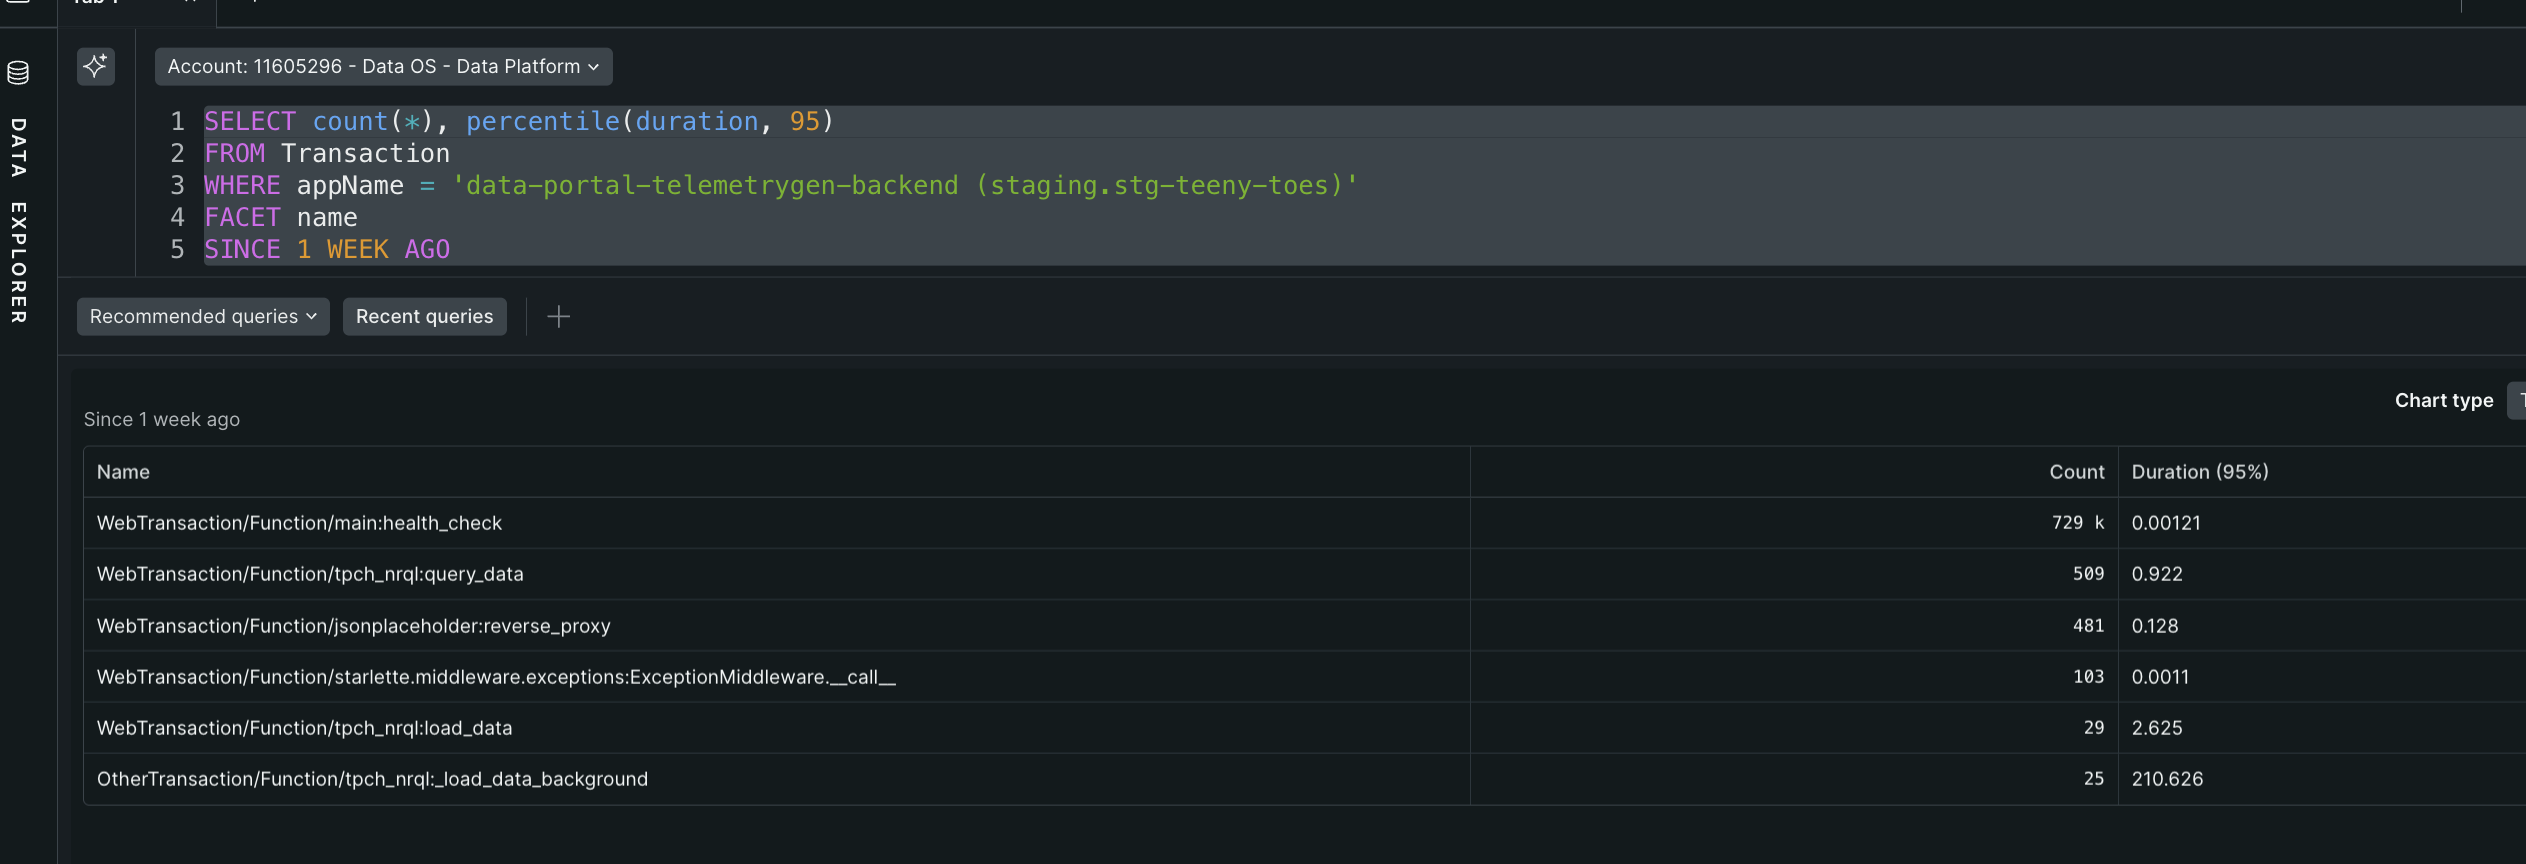
- “capability sli” - my understanding - the idea is that we create sli for our most critical business functionality. first, we find the baselines for most frequently used transactions (we are founding counts and finding their latency percentile)
SELECT count(*), percentile(duration, 95) FROM Transaction WHERE appName = 'data-portal-telemetrygen-backend (staging.stg-teeny-toes)' FACET name SINCE 1 WEEK AGO![]()
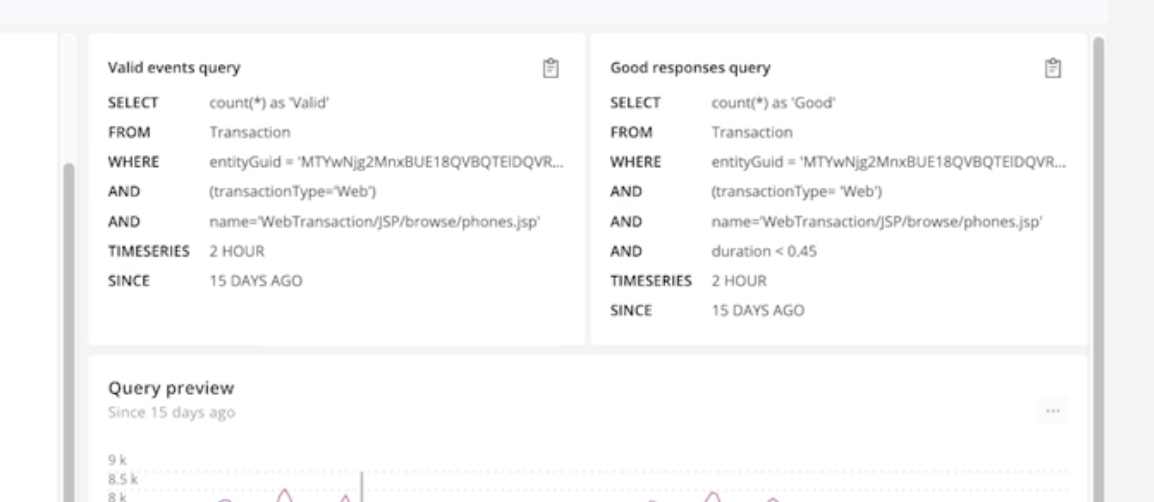
- then, just like we did for synthetic monitors, we create sli using nrql
![]()
- “detractors” - the values that primarily damage our slo. the idea would be to add for e.g. a “facet” using name to our original queries for these service levels to identify the transactions that cause our slo to drop. then, we can for e.g. add individual “capability sli” for these, debug the underlying cause, add filtering our change our slo, etc
Service Architecture Intelligence
- the four “dora” or “devops research and assessment” metrics -
- new relic change tracking feature integrates with ci / cd pipelines to automatically ingest deployment data. this helps capture “deployment frequency” (how often a team deploys code to production) and “lead time for changes” (how long it takes for a commit to get into production)
- new relic alerting and incident management features help capture “change failure rate” (when a deployment causes a failure) and “mean time to recovery (mttr)” (average time to resolve an issue)
- “internal developer portal” - internal product developed by a dedicated platform engineering team to simplify infrastructure for developers. idp helps standardize workflows for creating infrastructure, services, etc. it standardizes best practices, organizational standards, security, etc so that the developers can focus on building. this is also called “golden path”
- my understanding - the idea is that this idp would have new relic observability baked into it, thus eliminating the need for developers to do it themselves
- new relic has the following 4 features for implementing sai or “service architecture intelligence” - catalogs, teams, maps and scorecards
- “catalogs” - centralized repository for all services. unlike a static spreadsheet, it is dynamically updated with contextual information about the services, auto discovers the different services, etc
- “teams” - link services to engineering groups responsible for them. this helps identify the responsible teams during an incident, thus reducing mttr (“accountability”)
- “maps” - visualization of the topology of services and infrastructure. it automatically discovers services and then gets updated dynamically
- “scorecards” - provide a realtime score to each service. e.g. is the service instrumented using apm, does it have an slo defined, etc
- using scorecards, we can define “rules” using nrql (e.g. minimum apdex score)
- going beyond simple use cases with sai -
- automatically trigger “scorecard” checks on every code commit as part of ci cd pipeline
- using “teams”, track resource consumption as part of the finops strategy
Pipeline Control
- “filter” low value data before it reaches new relic
- “pipeline control gateway” - filter before data leaves our network
- “pipeline control cloud rules” - filter within new relic
- we need “organization product admin” and “organization manager” permissions
- applies to data from when we create the rule, and not the data already ingested
- pipeline control workflow -
- “gateway processing”
- “enrichment” - additional attributes are added, some attribute names are changed
- “cloud rules processing”
- stored into nrdb
- so, the attributes added during enrichment can only be filtered during cloud rules processing, but not in gateway processing
- they basically have a helm chart which we can install to deploy the cluster
- a gateway can have multiple “clusters”. use case - we have multiple kubernetes clusters in different regions. so, we can have a cluster per region, all connected to the same gateway
Account Structure
- proper account structure planning is important for security, ease of management, cost, etc
- “organization” - aligned with customers. organizations contain “accounts”
- “accounts” - accounts contain “data”. it also contains settings like retention etc
- “authentication domains” - determine how users access new relic (e.g. sso or email based). we can have multiple authentication domains in an organization
- each account has a unique “account id”. we should have clear naming conventions for accounts, e.g. incorporating environment type (prod, dev), team name, etc
- access to data is controlled at account level - a user with access to an account can query any data in that account. while we can have granular permissions around what actions users can perform - e.g. creating dashboards or configuring alerts, but the visibility of data remains consistent
- so, accounts are the primary organizational unit that control “data ingestion”, “access control”, “querying”, “billing”, etc
- users are added to an organization, and then granted permissions for accounts in that organization
- “organization admins” have the highest level of access and can manage all aspects of it like user creation, billing, etc
- organizations help with user management, consolidated billing, etc
- best practice for “authentication domains” - maintain a separate authentication domain with a small number of highly privileged users. ensure this emergency authentication domain uses a different authentication method than your primary authentication domain
- best practice for sso - implement “aum” or “automated user management”. it uses “scim” or “system for cross domain identity management” protocol to automate creation to deactivation of users
- when configuring “agents”, we specify “ingest keys” which help direct this data to an account. so, an “ingest key” is always linked to a single “account”
- multiple sources can use the same ingest key to send data to the same account
- there are limits on the accounts on number of agent instances (50000), number of records per minute (55 million), etc
- the granular permissions on an account can be on actions e.g. creating dashboards, but not on data visibility. so, we would need separate accounts if we want control over data visibility as well
- while data visibility is all or nothing for an account, we can use “roles” to provide access to either only view data vs edit for e.g. “alerts”, “dashboards”, “service level indicators”, etc. these are called “mutation permissions”
- some account setup strategies -
- “single account” - simplest to manage, but lacks access control, environment separation, increases blast radius, etc
- “business unit / function based accounts” - each team’s services sends data into their own account (or set of accounts e.g. prod and non prod for every team)
- “production / non production” - just two accounts. it is one of the most common setups. additionally, instead of just one account for non production, we can separate it into multiple accounts instead - development, staging, user acceptance testing, etc. it basically matches the “sdlc” or “software development life cycle” of the company
- “shared services account” - for infra teams handling shared services like monitoring of “kubernetes clusters”. they typically go to a central shared services account. “platform teams” are the owners with administrative privileges, while “consumer teams” who consume the shared service have read only access to dashboards etc. consumer teams can continue sending application specific telemetry to their own dedicated accounts
- “reporting account” - dedicated account for consolidated billing. we isolate this account from all kinds of telemetry data. finance teams can now access billing data without touching sensitive operational data. note - an organization can only have one consolidated reporting account
- recall how we said for “business unit” strategy that we can have multiple accounts per team. so i believe multiple levels of nesting for child accounts is supported as well
- when we are migrating to say a new account structure, historical telemetry data generally stays in the old accounts for its retention period. migration efforts should focus on redirecting the flow of new data to the new account structure
- e.g. consistently slow dashboards or frequent slow query times could point to an account being too large for certain types of queries
- my understanding of how access control is done -
- “users” are added to “groups”
- “groups” are given access to “accounts” via “roles”
- groups belong to a specific “authentication domain”
- so, only users of that specific authentication domain can be part of that group